footprints
Purpose
Interactive footprint map viewer for ISIS cube files. Shows image coverage areas on a map with per-image coloring and optional control network overlay. Also supports static PNG export for reports and publications.
Usage
# Interactive browser viewer (default)
isistools footprints cubes.lis

# With control network overlay
isistools footprints cubes.lis --cnet control.net

# Native matplotlib window (with hover tooltips)
isistools footprints cubes.lis --win

# Static PNG export
isistools footprints cubes.lis --png
isistools footprints cubes.lis --png --title "MC-13E Gap Region" --dpi 200

# PNG with custom output path
isistools footprints cubes.lis --png-path my_overview.png
Options
| Option | Default | Description |
|---|---|---|
--cnet, -c |
— | Control network file (.net) to overlay |
--png |
off | Save static PNG instead of launching viewer |
--png-path |
footprints_overview.png |
Custom output path (implies --png) |
--dpi |
150 | PNG resolution |
--title, -t |
cubelist filename | Figure title |
--win |
off | Native matplotlib window instead of browser |
--port, -p |
0 (auto) | Server port for browser viewer |
--no-browser |
off | Start server without opening browser |
Output modes
Browser viewer (default)
Launches a Panel/HoloViews app in the browser with:
- Interactive pan, zoom, and box-select
- Per-image color coding with legend
- Hover info showing image metadata
- Optional control network point overlay
Native matplotlib window (--win)
Opens a native Qt window with:
- Standard matplotlib zoom/pan toolbar
- Hover tooltips showing CTX product ID (via mplcursors)
- Per-image color coding with right-side legend
Static PNG (--png)
Generates a publication-ready PNG using the headless Agg backend. No GUI dependency — works on remote servers and in CI pipelines.
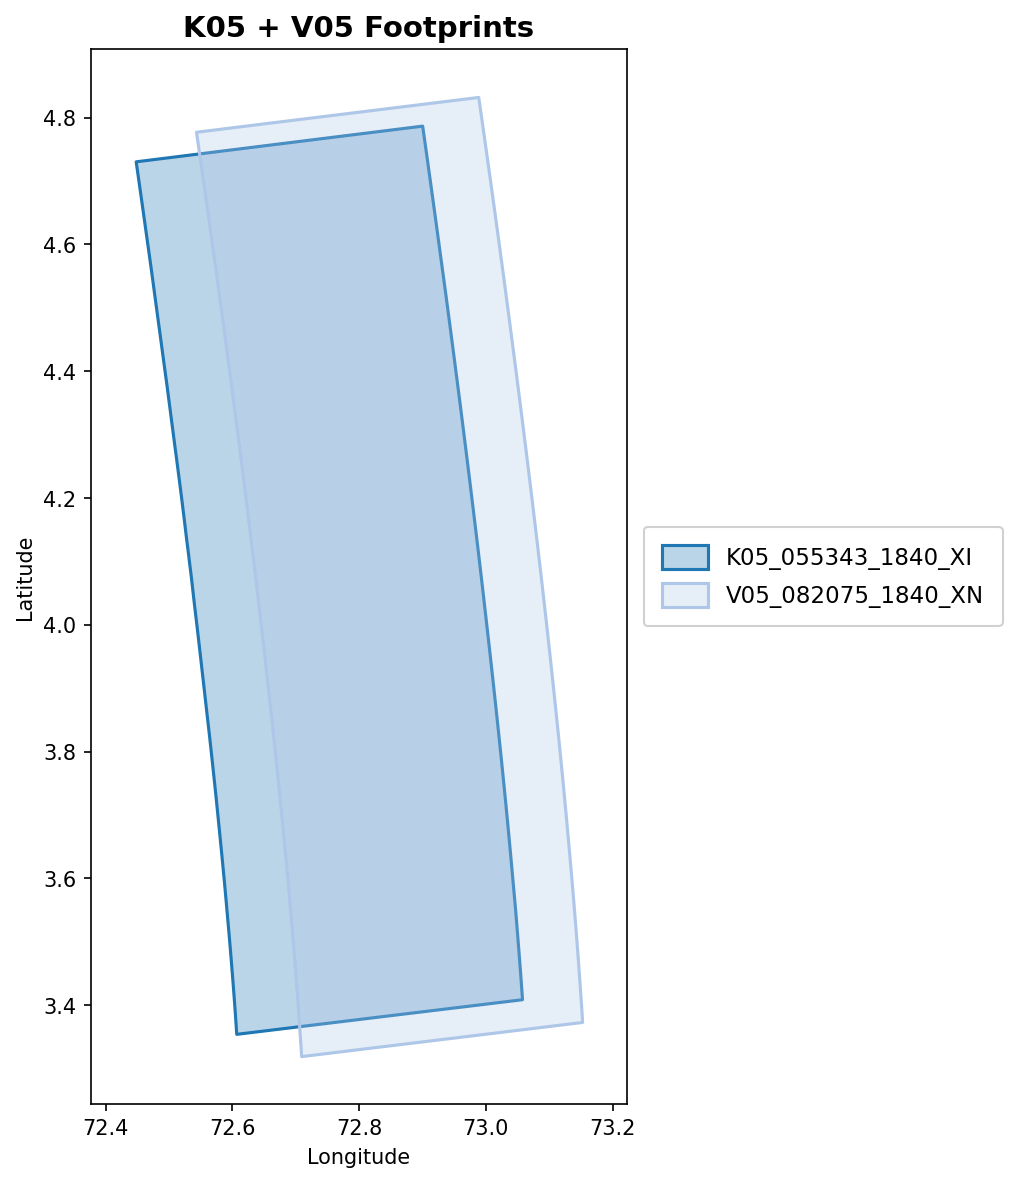
Example
Two overlapping CTX images (K05_055343 + V05_082075) in the MC-13E gap region:
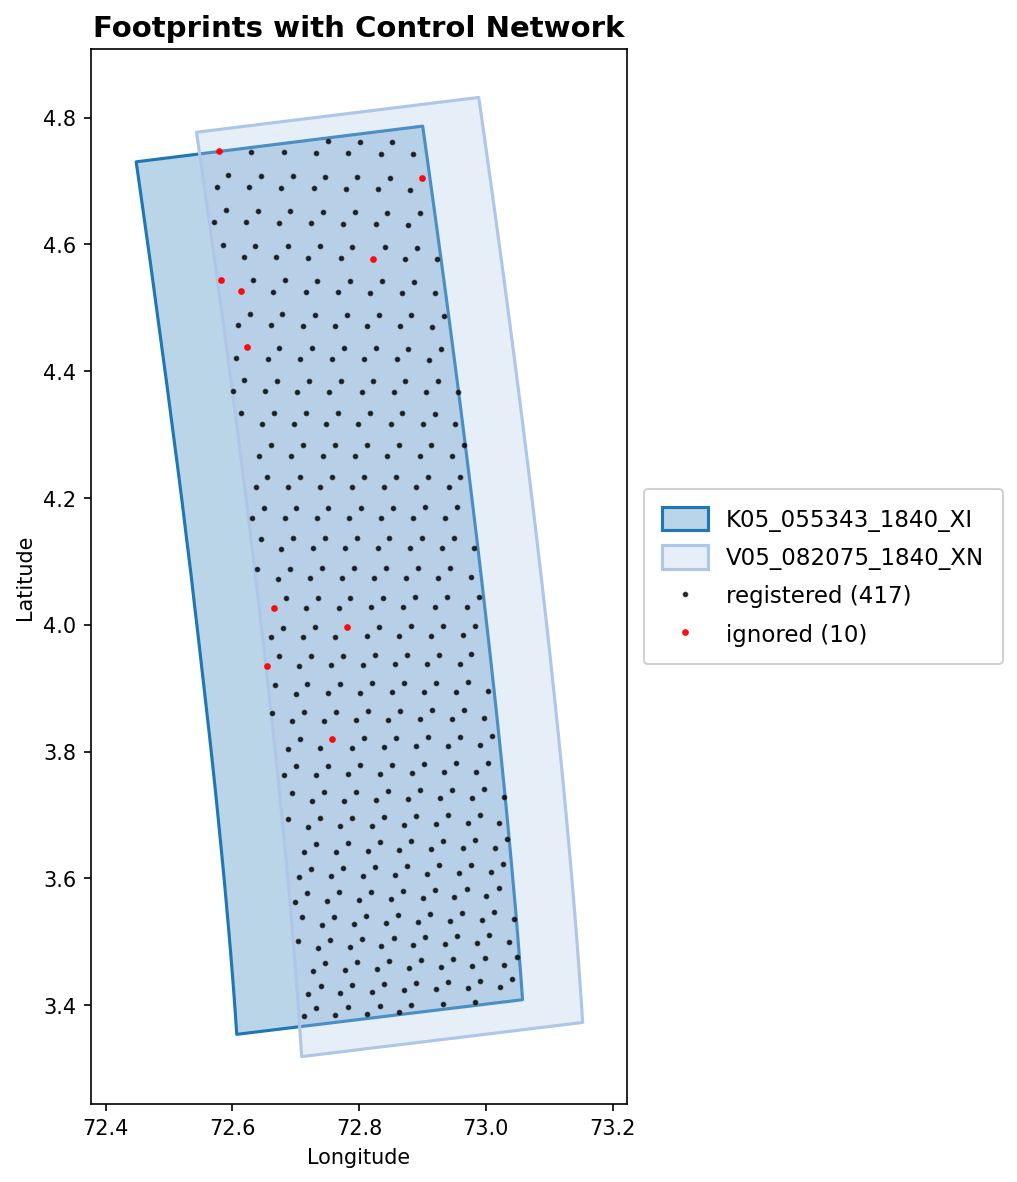
With --cnet, control network points are overlaid and color-coded by status (registered, unregistered, ignored):
Input format
The cube list file is a plain text file with one cube path per line. Blank lines and lines starting with # are skipped:
# K05 and V05 level-1 cubes
/path/to/K05_055343_1840_XI_04N287W.lev1.cub
/path/to/V05_082075_1840_XN_04N287W.lev1.cub
Python API
from isistools.io.footprints import load_footprints
from isistools.plotting.footprint_mpl import footprint_png, footprint_window

gdf = load_footprints("cubes.lis")

# Static PNG
footprint_png(gdf, "overview.png", title="My Mosaic", dpi=200)

# Interactive window
footprint_window(gdf, title="My Mosaic")