Citizen Science on Mars — and the Surface Coverage of Dark Regolith on the Seasonal South Polar Ice Cap

K.-Michael Aye

Freie Universität Berlin

Planetary Sciences and Remote Sensing — Freie Universität Berlin

Tom Ihro

Freie Universität Berlin

Tim Michaels

University of Wisconsin–Madison

Ganna Portyankina

Deutsches Zentrum für Luft- und Raumfahrt (DLR)

Candice J. Hansen

Planetary Science Institute

Megan E. Schwamb

Queen’s University Belfast

04 Jun 2026

Outline

  1. Citizen science — what it is, why it works
  2. Planet Four — mapping CO2-jet deposits on Mars with 40 000 volunteers
  3. Surface coverage — how much of the seasonal ice is darkened, and why it matters
  4. A cautionary tale — how an “inter-annual trend” turned out to be a sampling artifact
  5. Where we go next — a parallel albedo channel and an AI to scale it up

I · Citizen Science

What is citizen science, practically?

  • Problem: a simple but arduous, repetitive task — too much data to go through yourself
  • Solution: split the task into screen-sized subtasks
  • Present the data through a simple workflow to thousands of untrained volunteers
  • Aggregate many independent judgements into one reliable measurement

What’s in it for everyone?

For scientists

  • Data volume grows exponentially — humans don’t scale
  • Ideal for simple-but-arduous questions
  • Labeled data is always better — CS is an efficient label factory for ML
  • Genuine public-engagement opportunity

For citizens

  • Participate in real research
  • Independent of prior education
  • A wide variety of fields now offer CS projects
  • A core community forms around shared goals

Origins — Zooniverse & Galaxy Zoo

  • Zooniverse took off with Galaxy Zoo (2007) — classify galaxy morphology
  • Dozens of papers before planetary science even joined
  • Galaxy shape distributions had to be redefined thanks to volunteer classifications
  • The platform now hosts hundreds of projects across every discipline

II · Planet Four

Planet Four — citizen science on Mars

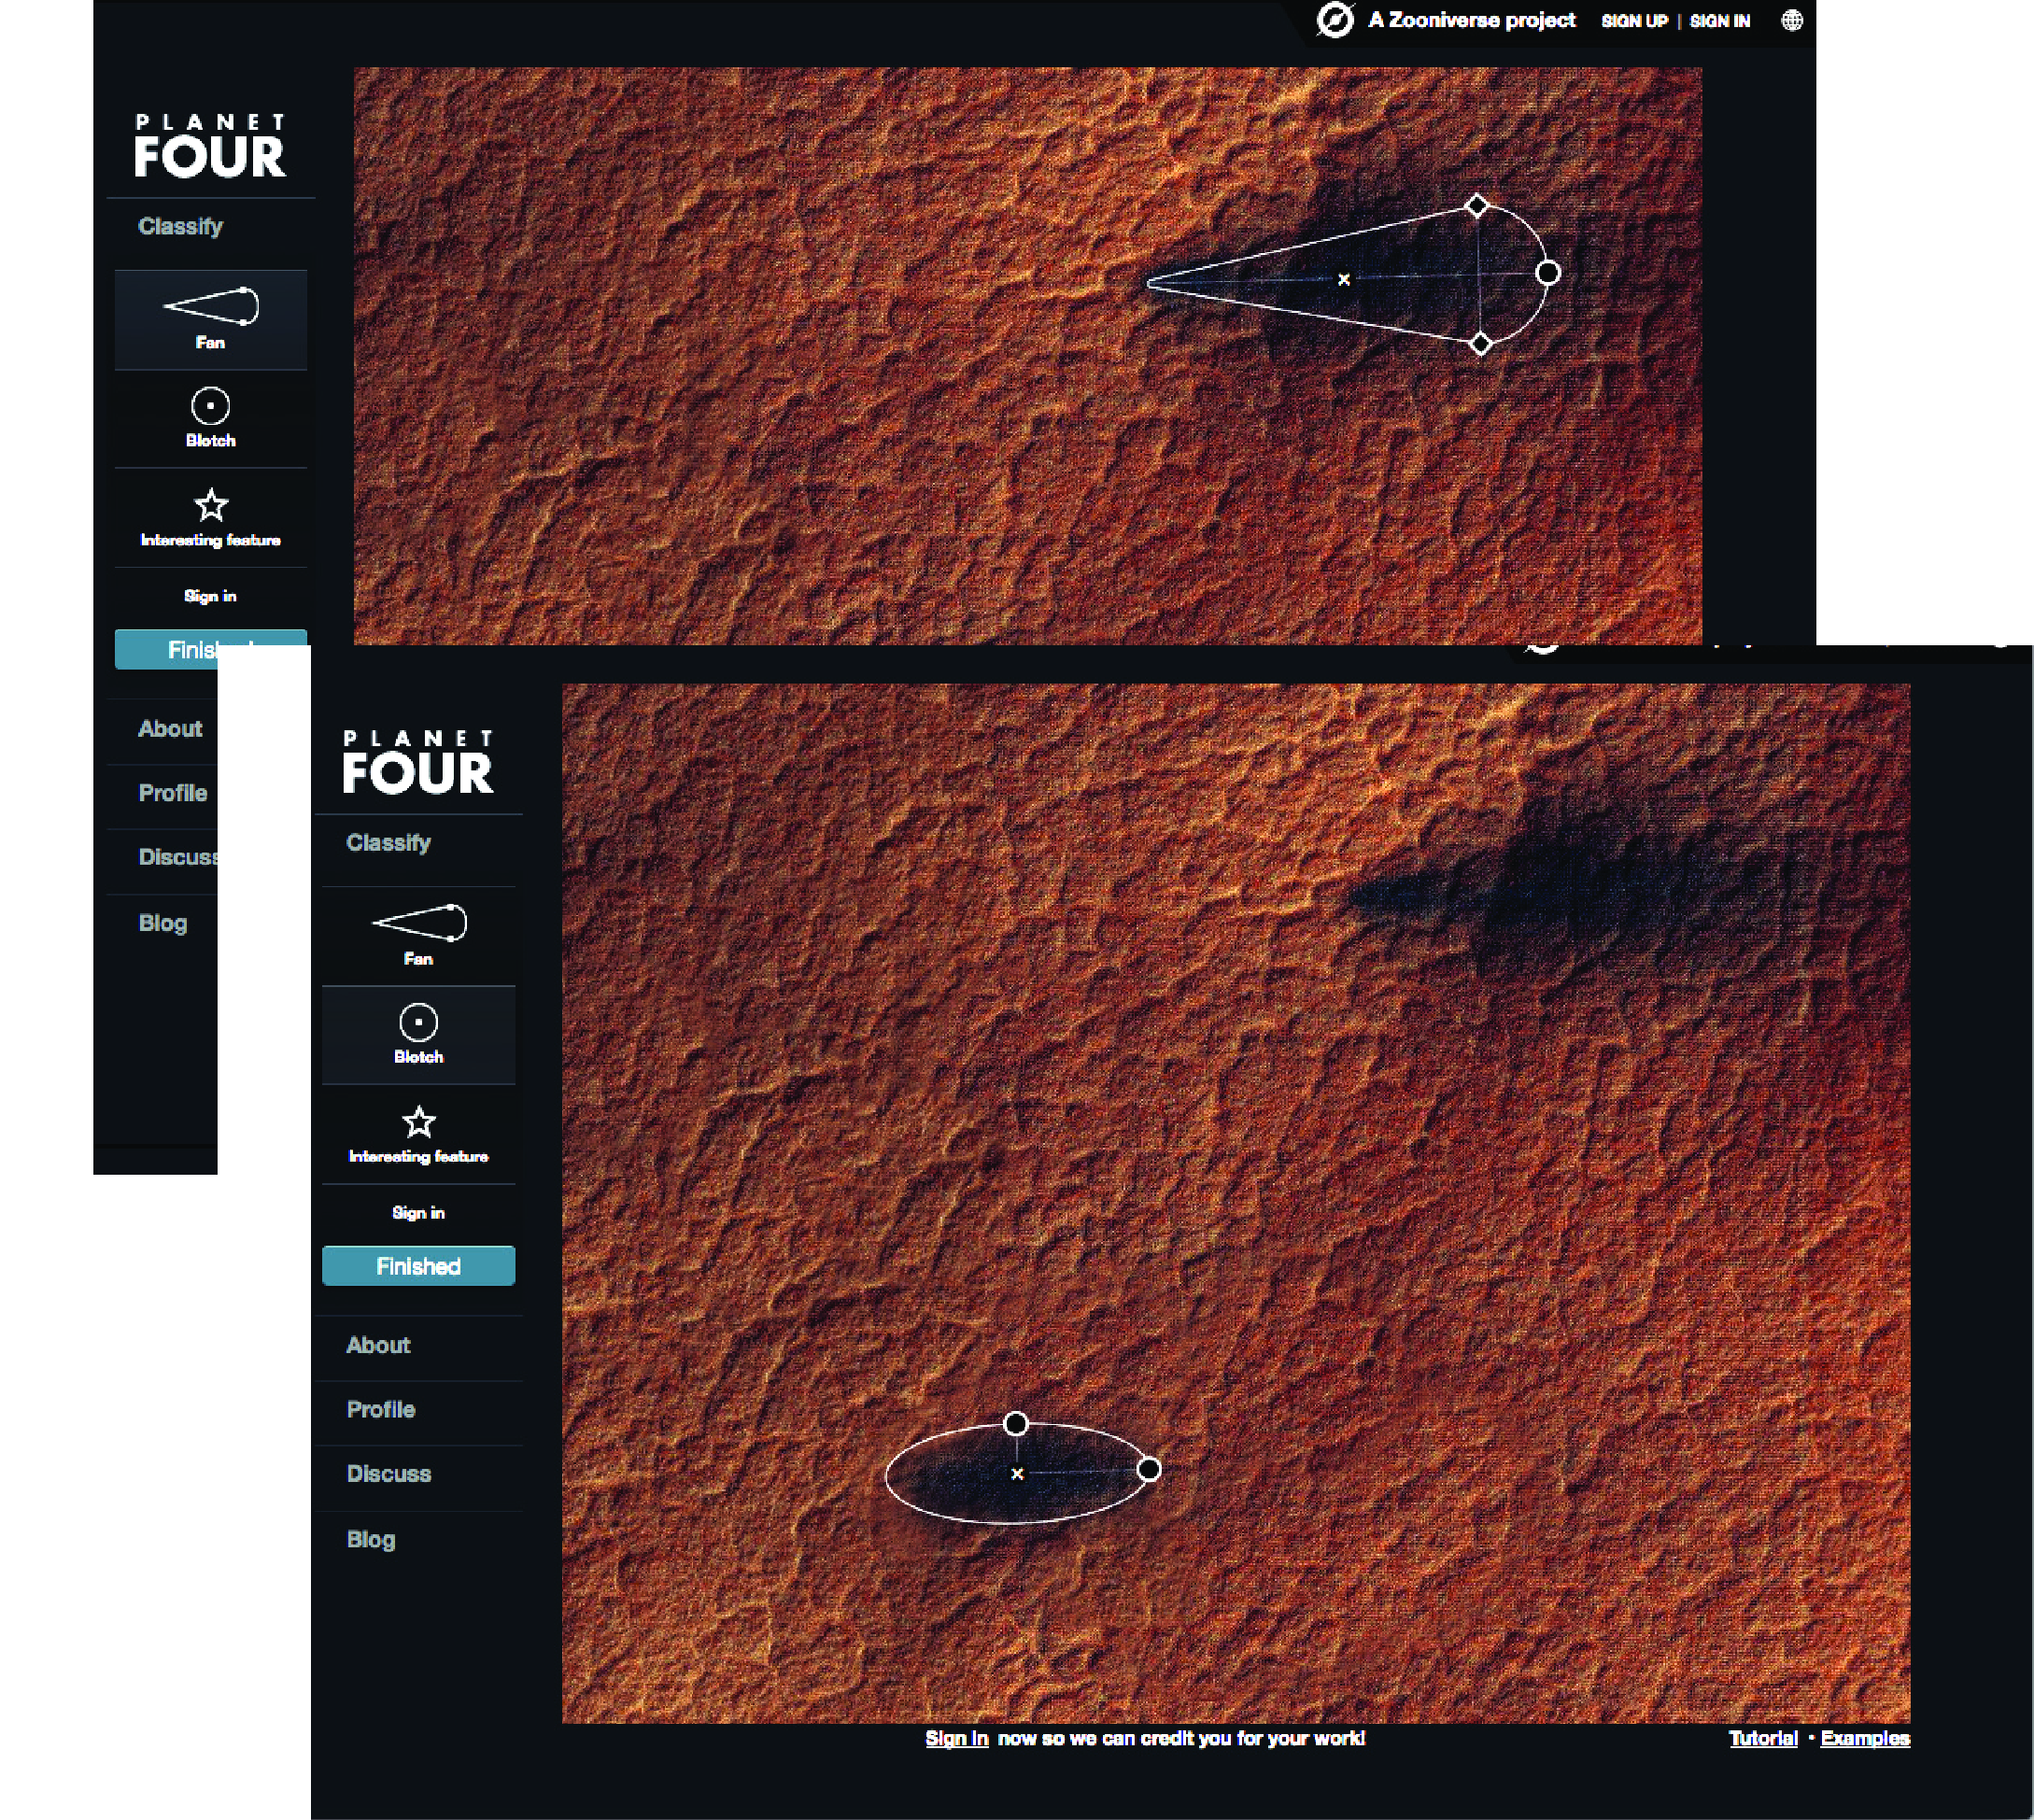
  • Zooniverse-hosted volunteer mapping; 40 000+ classifiers
  • Volunteers outline fans (directional CO2-jet deposits) and blotches (elliptical) on HiRISE south-polar tiles
  • Six Mars Years (MY 28–33) — 469 obs · 64 494 tiles (Aye et al. 2019)
  • Each tile seen by ≥ 30 independent volunteers before it counts

Science case — the Kieffer cold-jet model

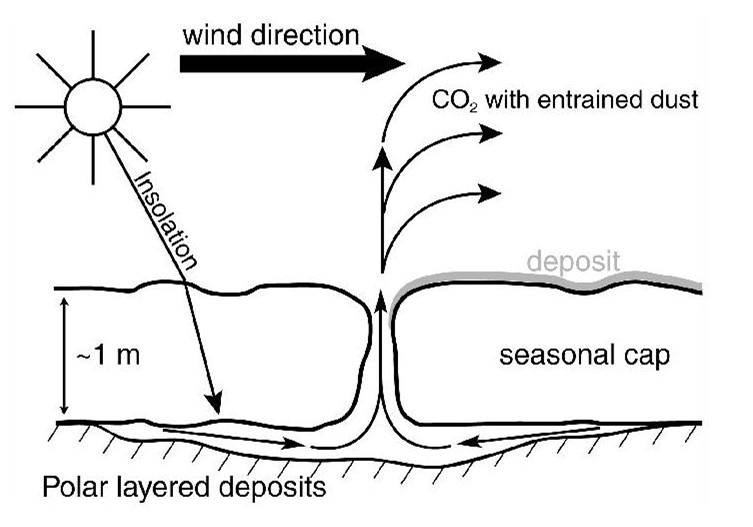
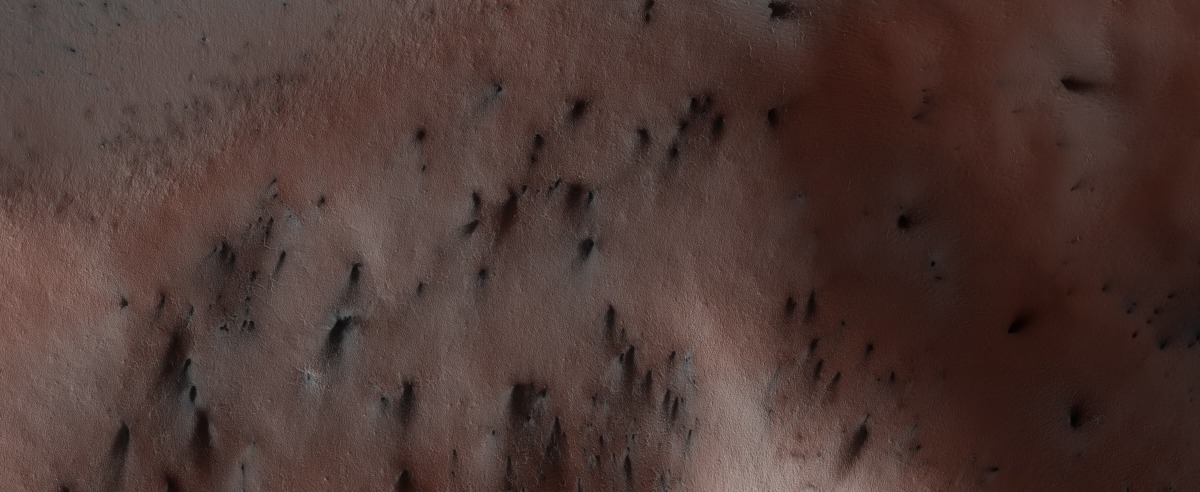
  • Spring sublimation of translucent CO2 slab ice → high-pressure gas vents through cracks
  • Subsurface regolith is ejected onto the bright seasonal ice as fan / blotch deposits
  • Fan shape is aligned with the prevailing wind at the moment of eruption (Kieffer 2007; Portyankina et al. 2022)

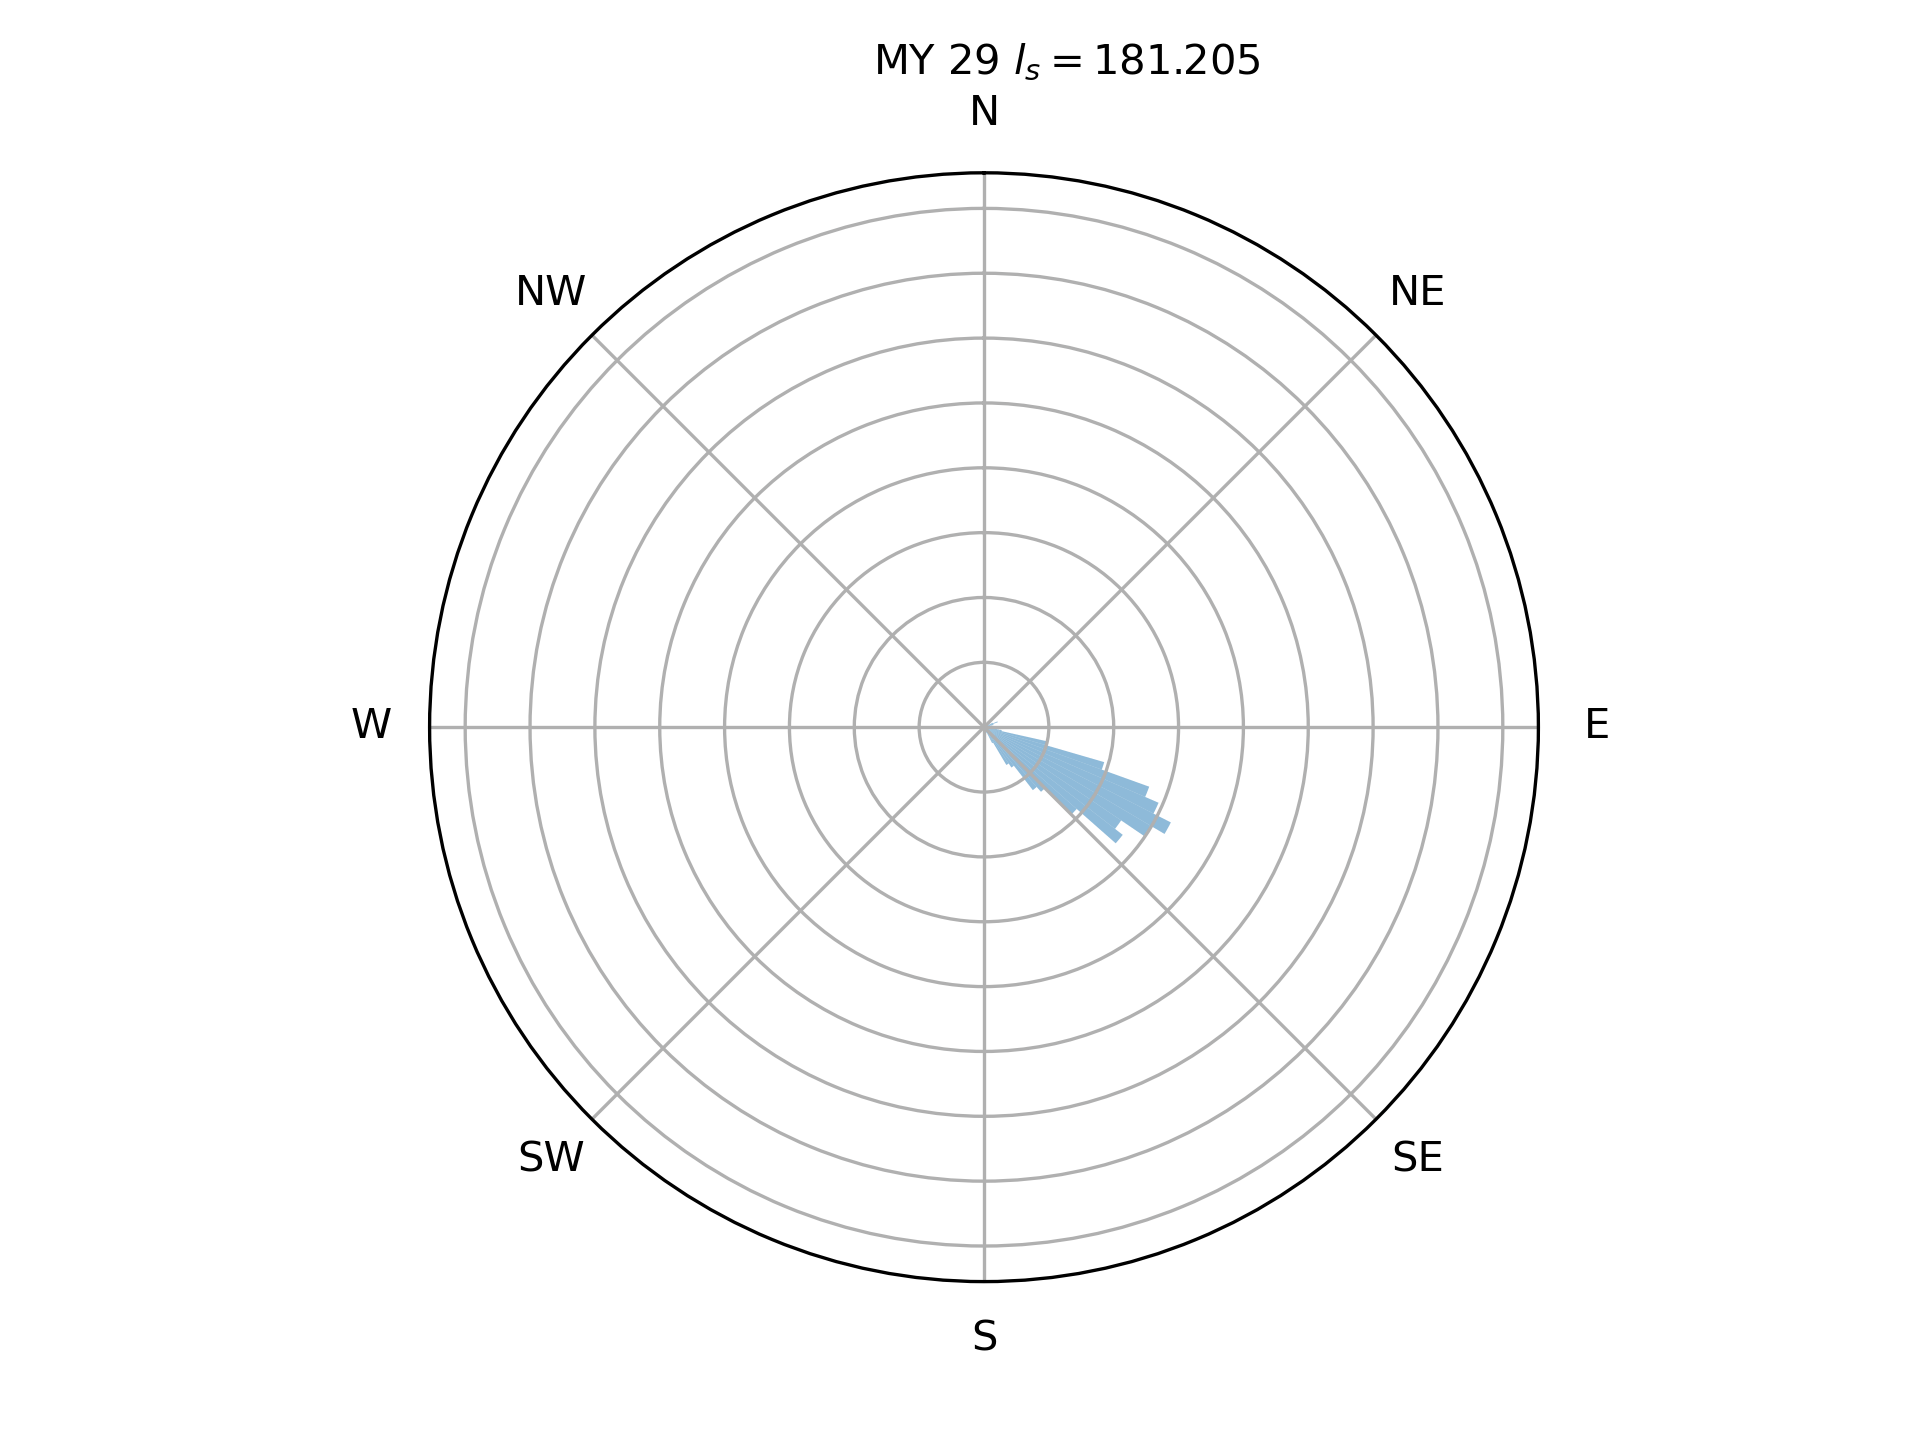
What volunteers map → wind data

Full HiRISE colour strip PSP_003092_0985 — fan deposits along the seasonal cap

Zoom — every dark fan is elongated in the same direction; that shared orientation is the wind signal
  • Fans: directional — angle, length, spread → a wind vector
  • Blotches: elliptical — no clear direction
  • A season of fans = wind measurements at hundreds of sites
  • “More wind data than we’ve ever had on Mars” — a known point in the season (to ~day precision via the imaging sequence), but never the time of day

Wind directions — sharp and repeatable

Giza fan directions accumulating through the season — one colour per HiRISE observation
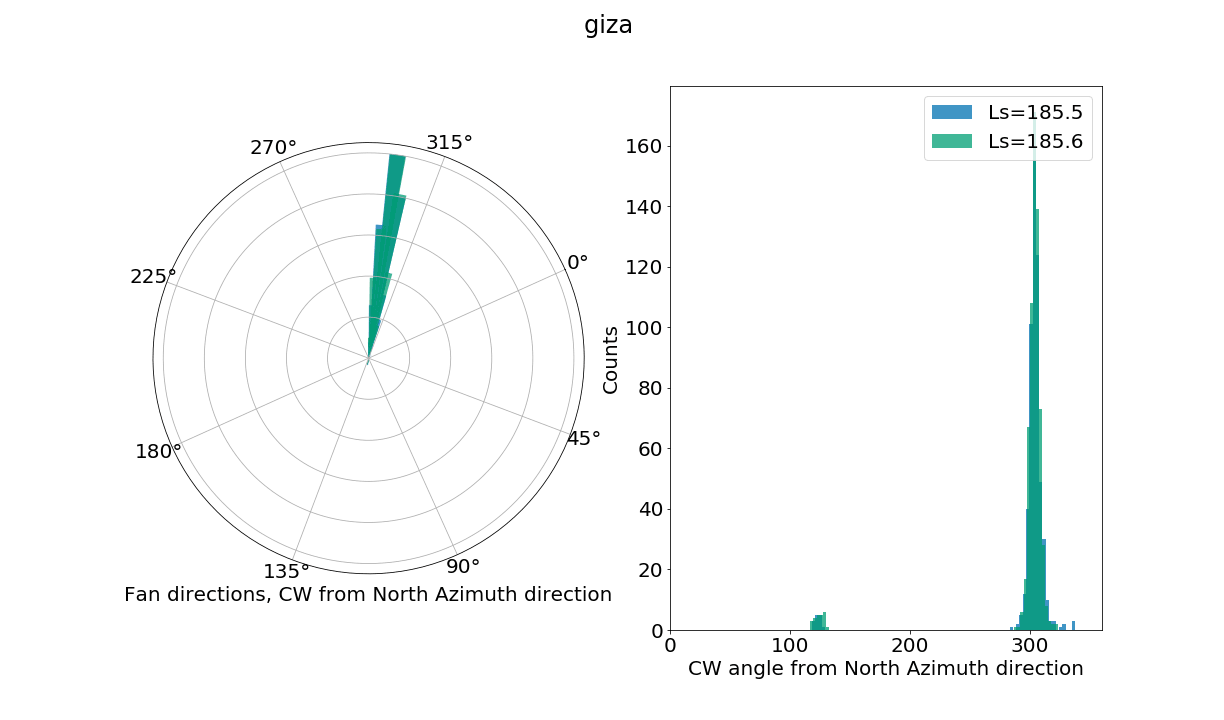
  • Each observation’s fan directions form a razor-sharp peak (here ~305°, NW)
  • Two observations at the same season coincide — Ls 185.5° vs 185.6° lie on top of each other
  • The seasonal rotation is orderly, and consistent across the two Mars Years analysed (MY 29–30) (Aye et al. 2019); reproduced by mesoscale models (Portyankina et al. 2022)
  • This is the most direct usable product: direction — while area or count are harder to interpret.

Active regions around the south pole

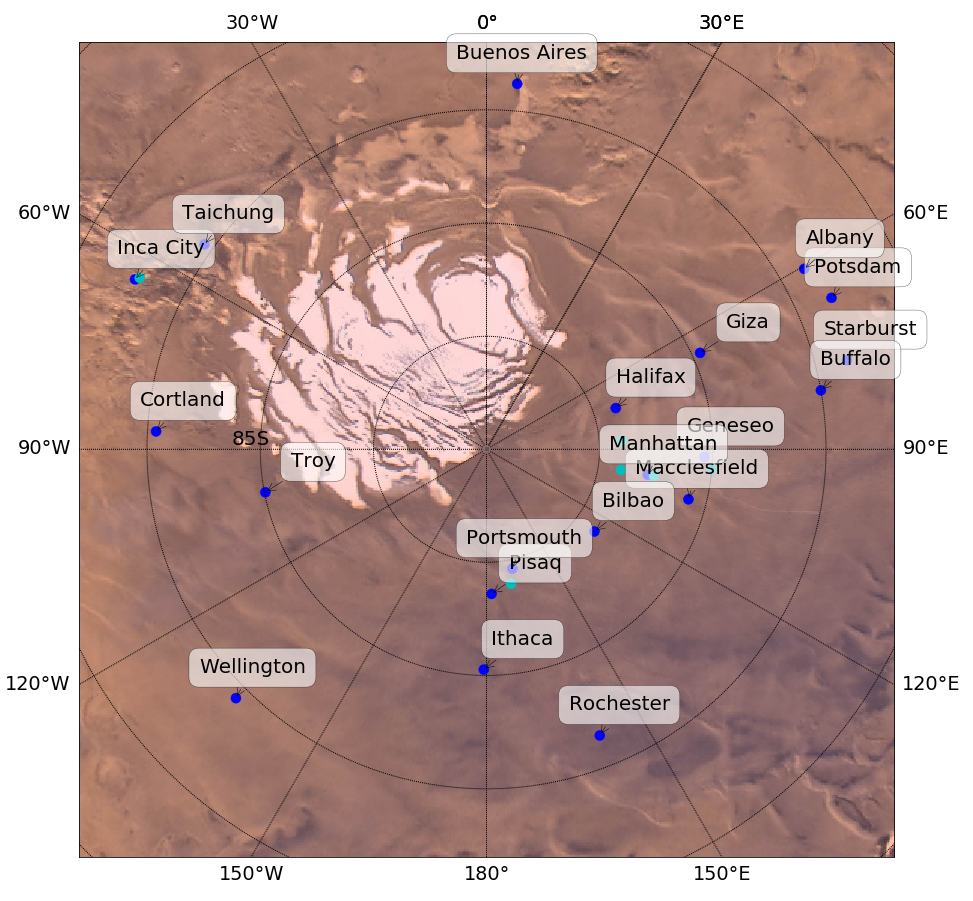
  • A HiRISE observation = one multi-filter image at one place and time
  • A ROI = a region of interest, re-imaged over years — but at very uneven time sampling
  • Seasonal campaigns at ~25 ROIs; enormous HiRISE data volume → the need for citizen science
  • Remember this map — the uneven sampling across ROIs and years is the punchline later

From classifications to a catalog

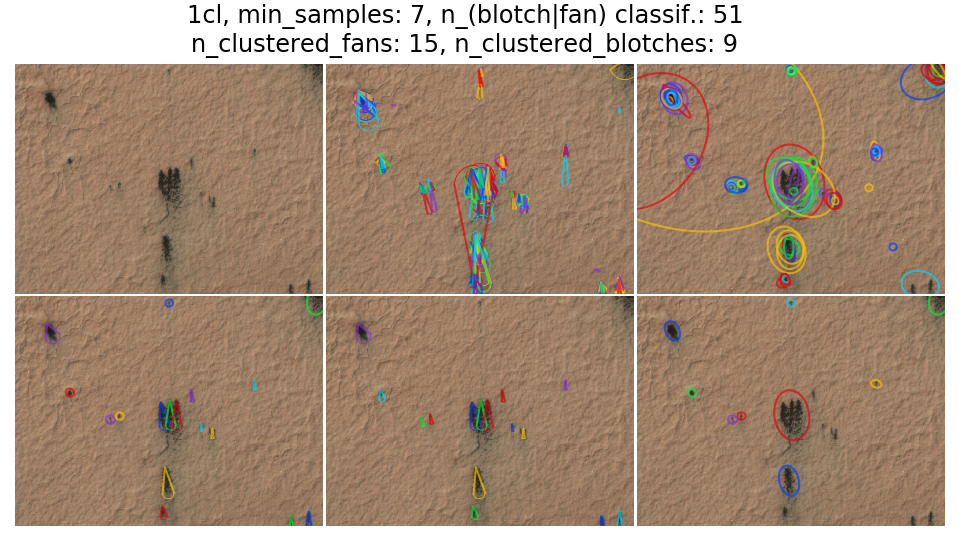
Clockwise from upper-left: raw tile → fan markings → blotch markings → blotch reduction → fan reduction → catalog entry at 50 % majority vote. Full pipeline in Aye et al. (2019).

Experts vs. citizens — the contrast problem

Blotch-area distributions on the same tiles — three science-team experts (GP, MES, KMA) vs the citizen catalog

  • Each science-team member (“gold” data) marked several hundred tiles
  • Significant disagreement between experts too
  • Experience does not overcome the core ambiguity: what contrast defines a feature’s edge?
  • Aggregated citizens track the experts — the crowd is not the weak link

What carries error — and what doesn’t: covered area and deposit counts inherit this edge ambiguity, but a fan’s measured wind direction is sharp and reliable.

Results — the v3.1 catalog, open & reachable

  • Over 40 000 volunteers contributed; a core of ~10–20 did most of the work
  • 64 494 tiles · 469 HiRISE observations · MY 28–33 · ~25 ROIs
  • Open release on Zenodo as part of the Planet Four Data Catalog

Two lines of Python via p4tools

from p4tools import io
fans = io.get_fan_catalog(version="v3.1")

III · Surface Coverage

Why surface coverage matters

  • Fresh CO2 ice albedo 0.6–0.8; deposited regolith ≲ 0.2
  • Coverage directly modulates the seasonal-cap energy balance, sublimation rate, and jet feedback
  • Modellers want a number
  • The canonical 20–30 % (Piqueux et al. 2003) is within the active cryptic terrainnot a cap-wide mean
  • Planet Four lets us replace the folklore number with a measured distribution

How we measure coverage

Per-tile fractional coverage (method by Tom Ihro)

  1. Each fan/blotch entry → a Shapely polygon in HiRISE pixel coordinates
  2. Coverage = union area of all polygons ÷ tile area
  3. Aggregate per observation: median, IQR, std across its tiles
  • Per-tile table: 64 494 tiles / 469 obs
  • ROI labels via p4tools.io.get_region_names()
  • Computed in pixel space (not ground-projected) — small effect at similar latitudes
  • 10° Ls bins balance time resolution vs. sample size

Overall coverage statistics

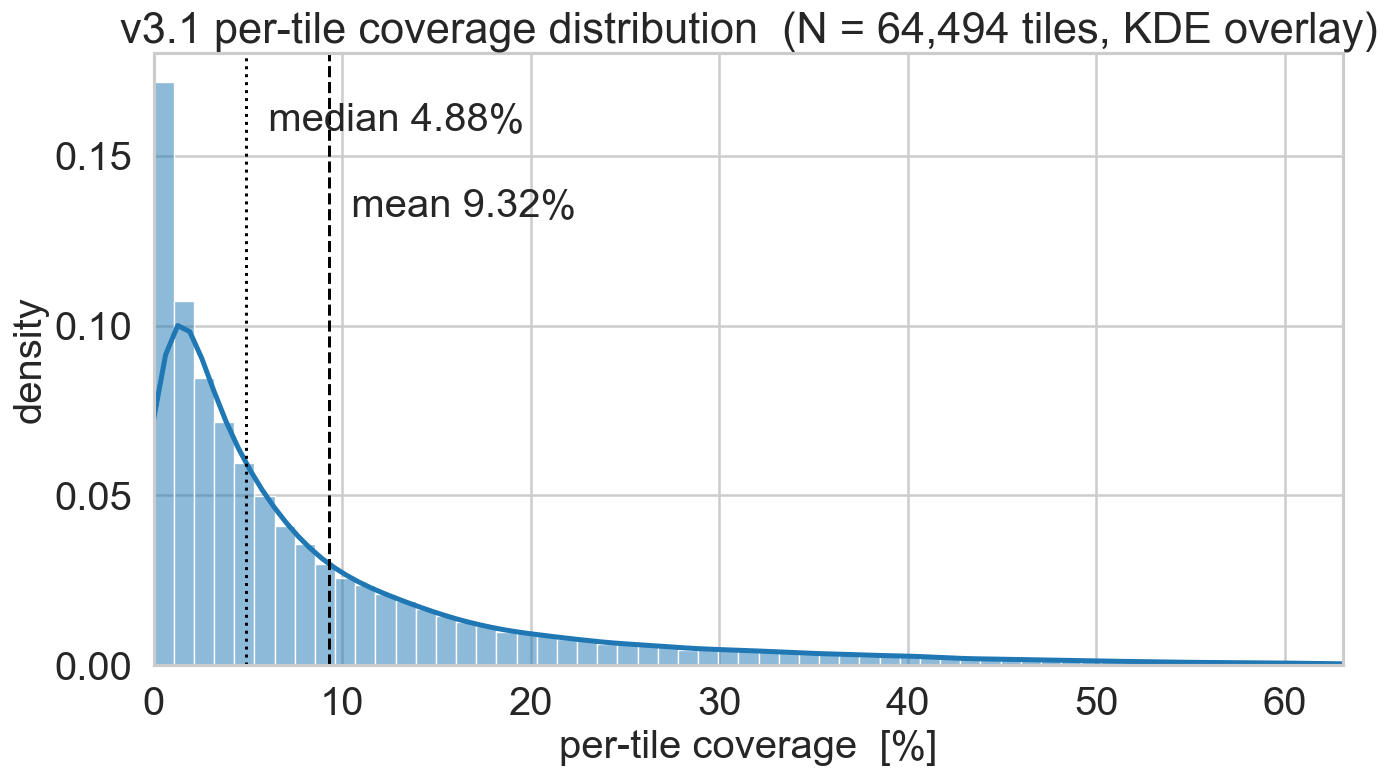
  • Cap-wide median 4.88 % · mean 9.32 %
  • Heavy right tail past 30 % — but only a small minority of tiles

Inter-annual — the distribution repeats

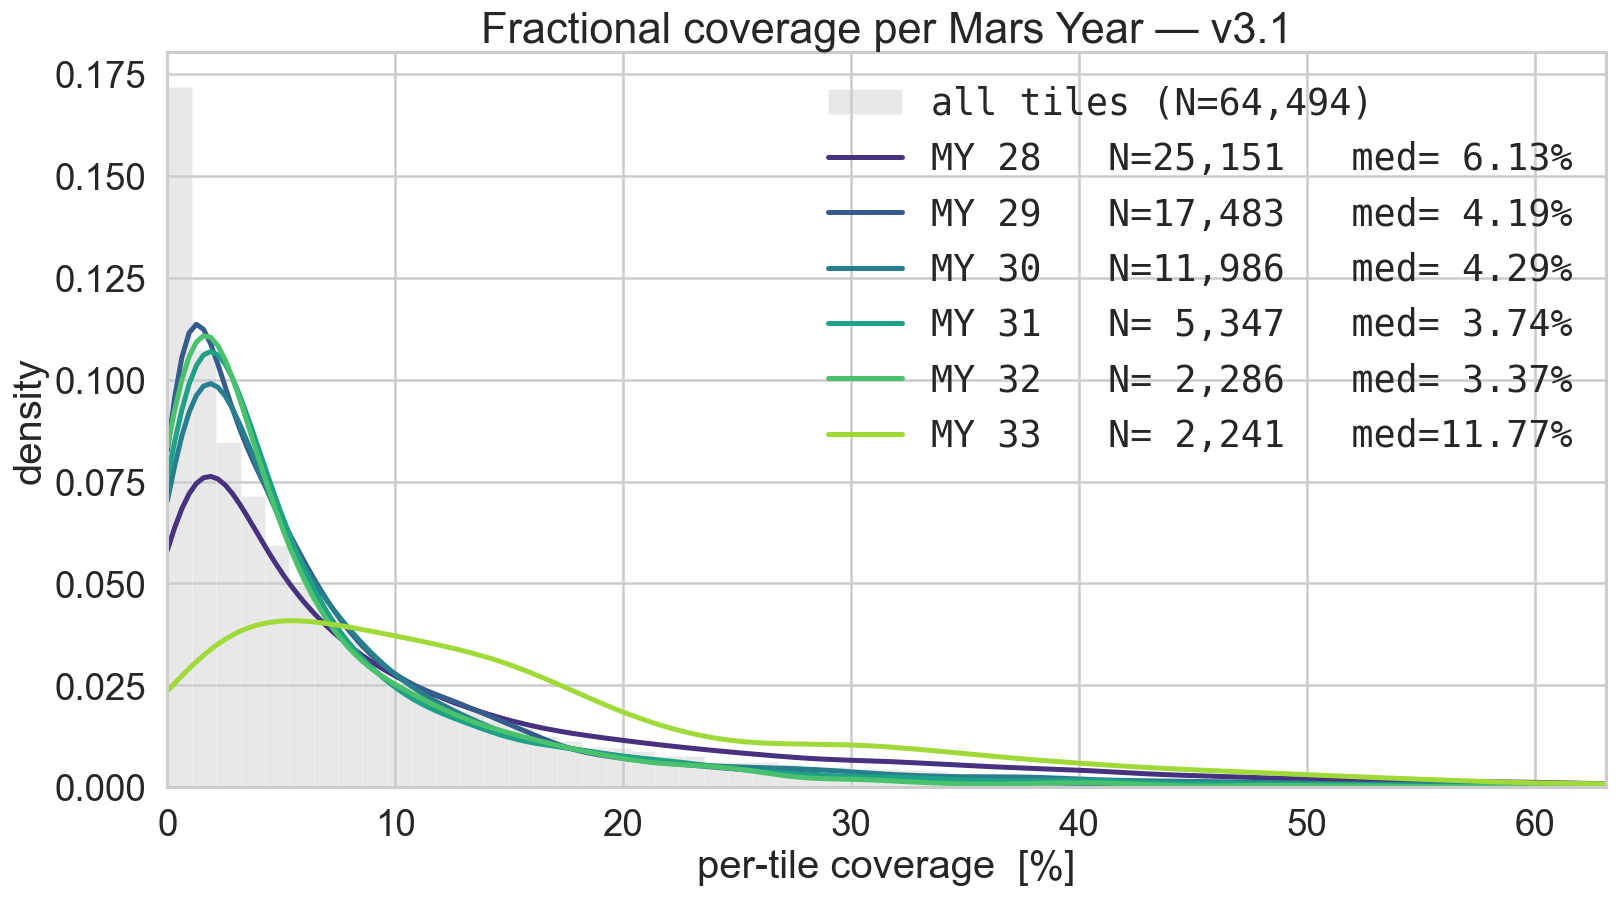
Distribution shape is strikingly repeatable across MY 28–32. So far, so reassuring…

IV · A Cautionary Tale

An apparent trend across Mars Years

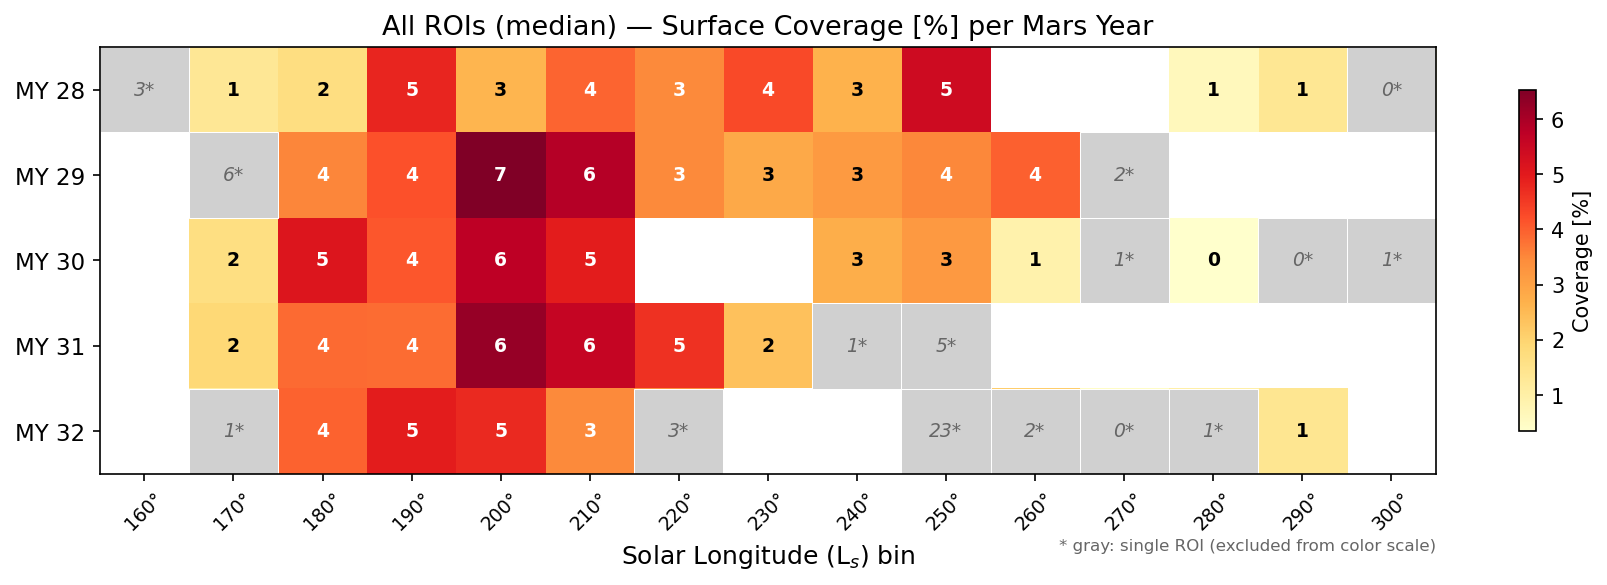
  • Aggregate everything: median coverage across all ROIs, per (MY × Ls) bin
  • The most recent Mars Year looked different — a tempting “inter-annual trend”
  • It is easy to say here: “coverage trends are changing year over year”

The catch — who was actually sampled?

Median coverage per ROI · rows = MY · cols = Ls · ★ = Ithaca (separate scale)
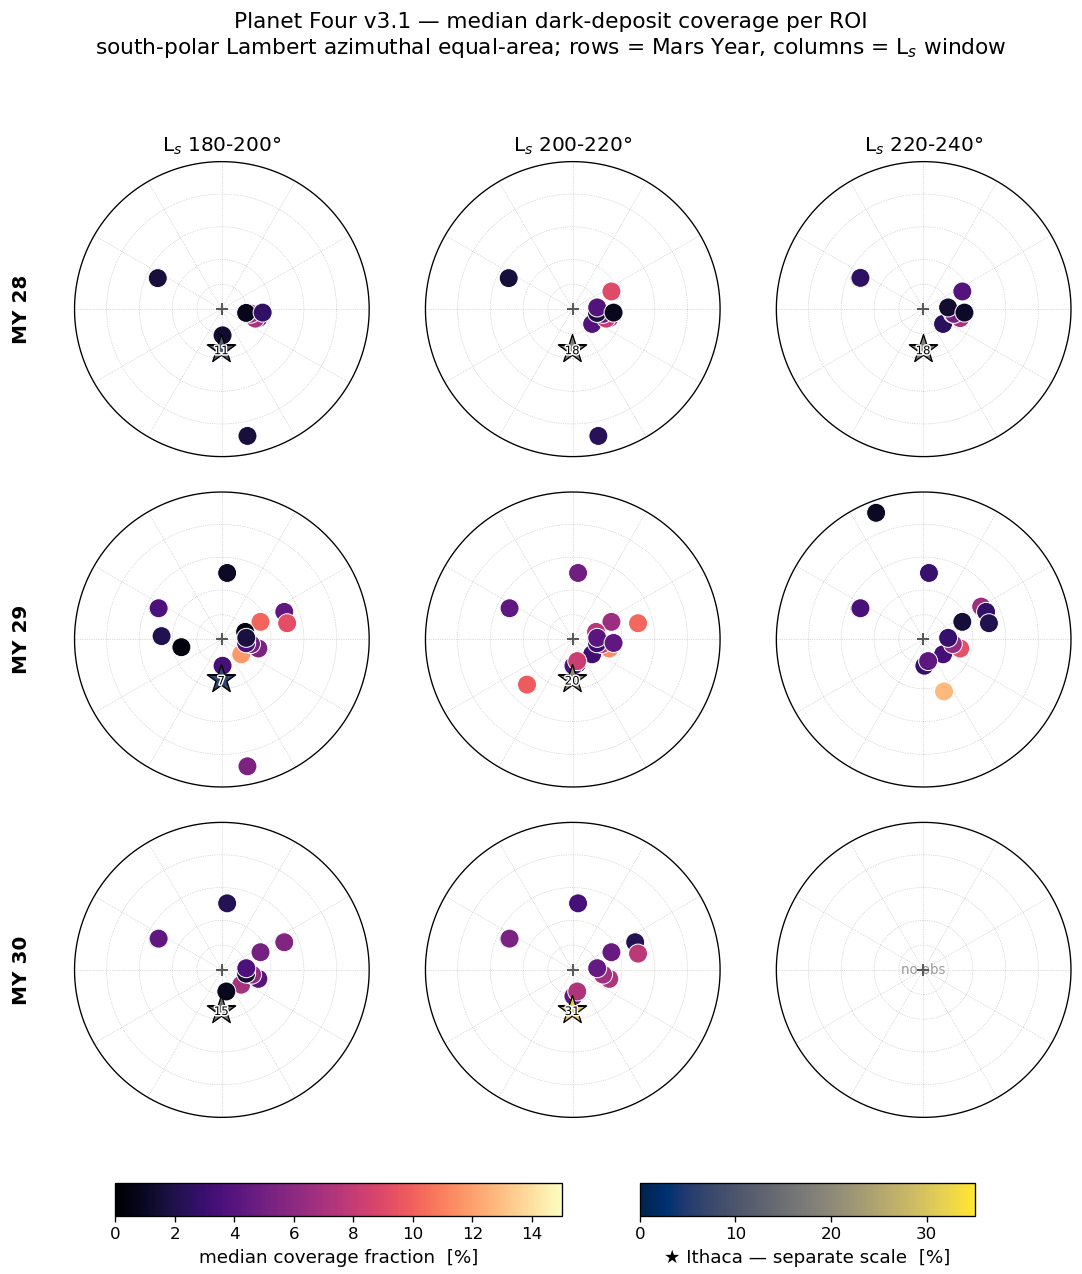
  • Each panel is a south-polar map — one dot per ROI, coloured by median coverage
  • MY 28–30: richly sampled — 16–25 ROIs each, dots across the whole pole
  • This is the regime our intuition is calibrated on…
  • …now watch what happens to the sampling in the later Mars Years →

…and then the sampling collapses

MY 31–33 — the same maps, emptying out
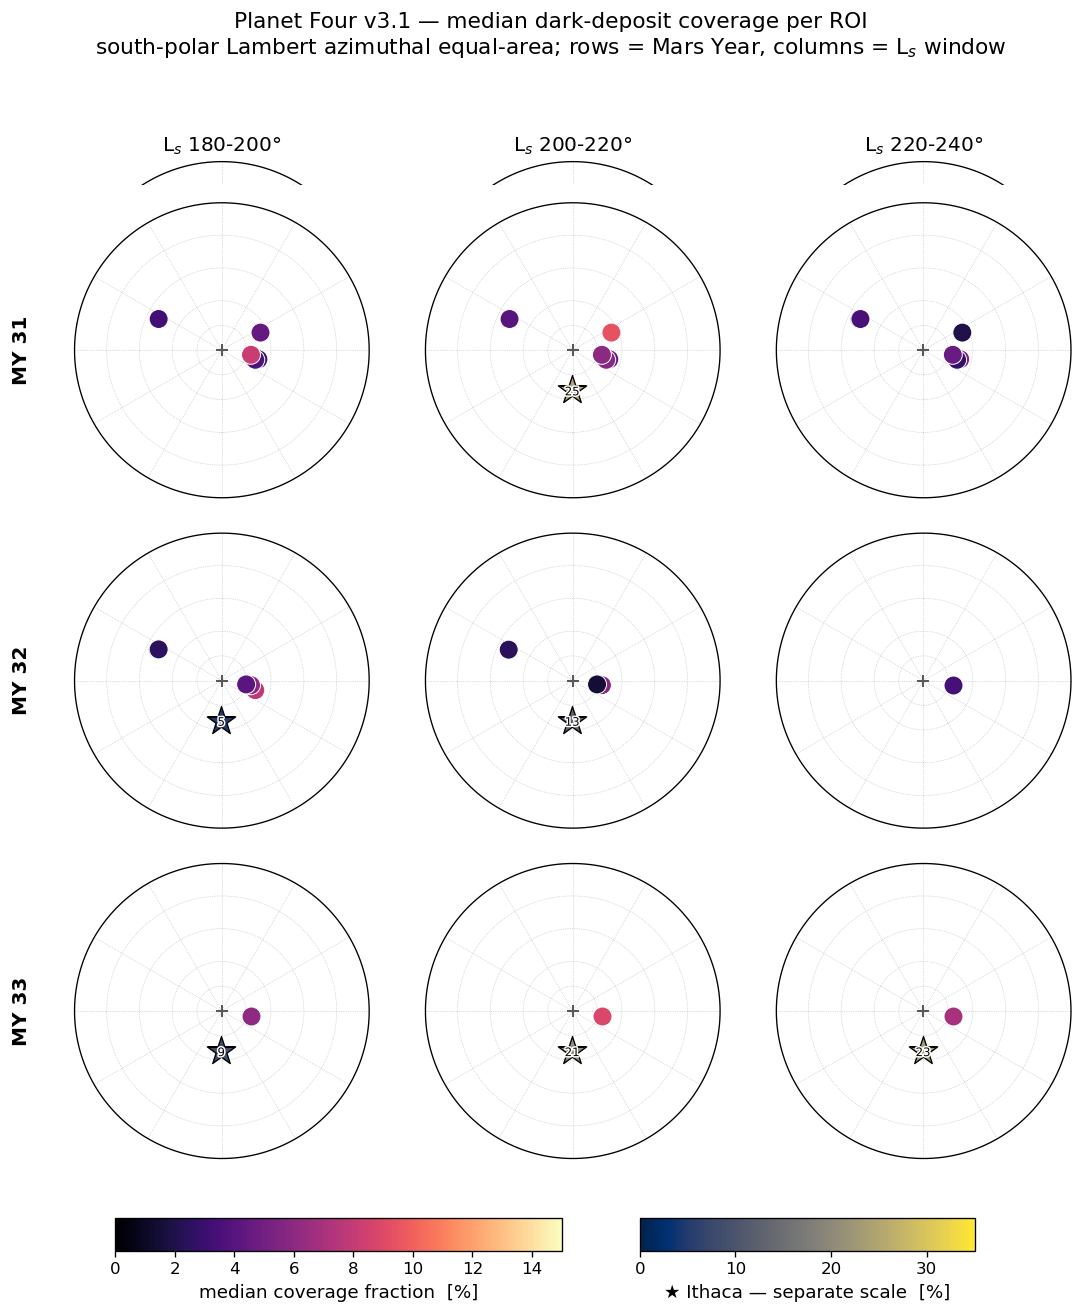
  • ROI count falls over the mission: 16 → 25 → 16 → 7 → 6 → 2
  • MY 33: almost empty — only 2 ROIs (13 observations), one of them Ithaca, the 10× outlier (★)
  • So the MY 33 “all-ROI average” is really “Ithaca and one neighbour”not comparable to years built from 16–25 regions
  • The apparent inter-annual trend was composition, not climate

The fix — read it within each ROI

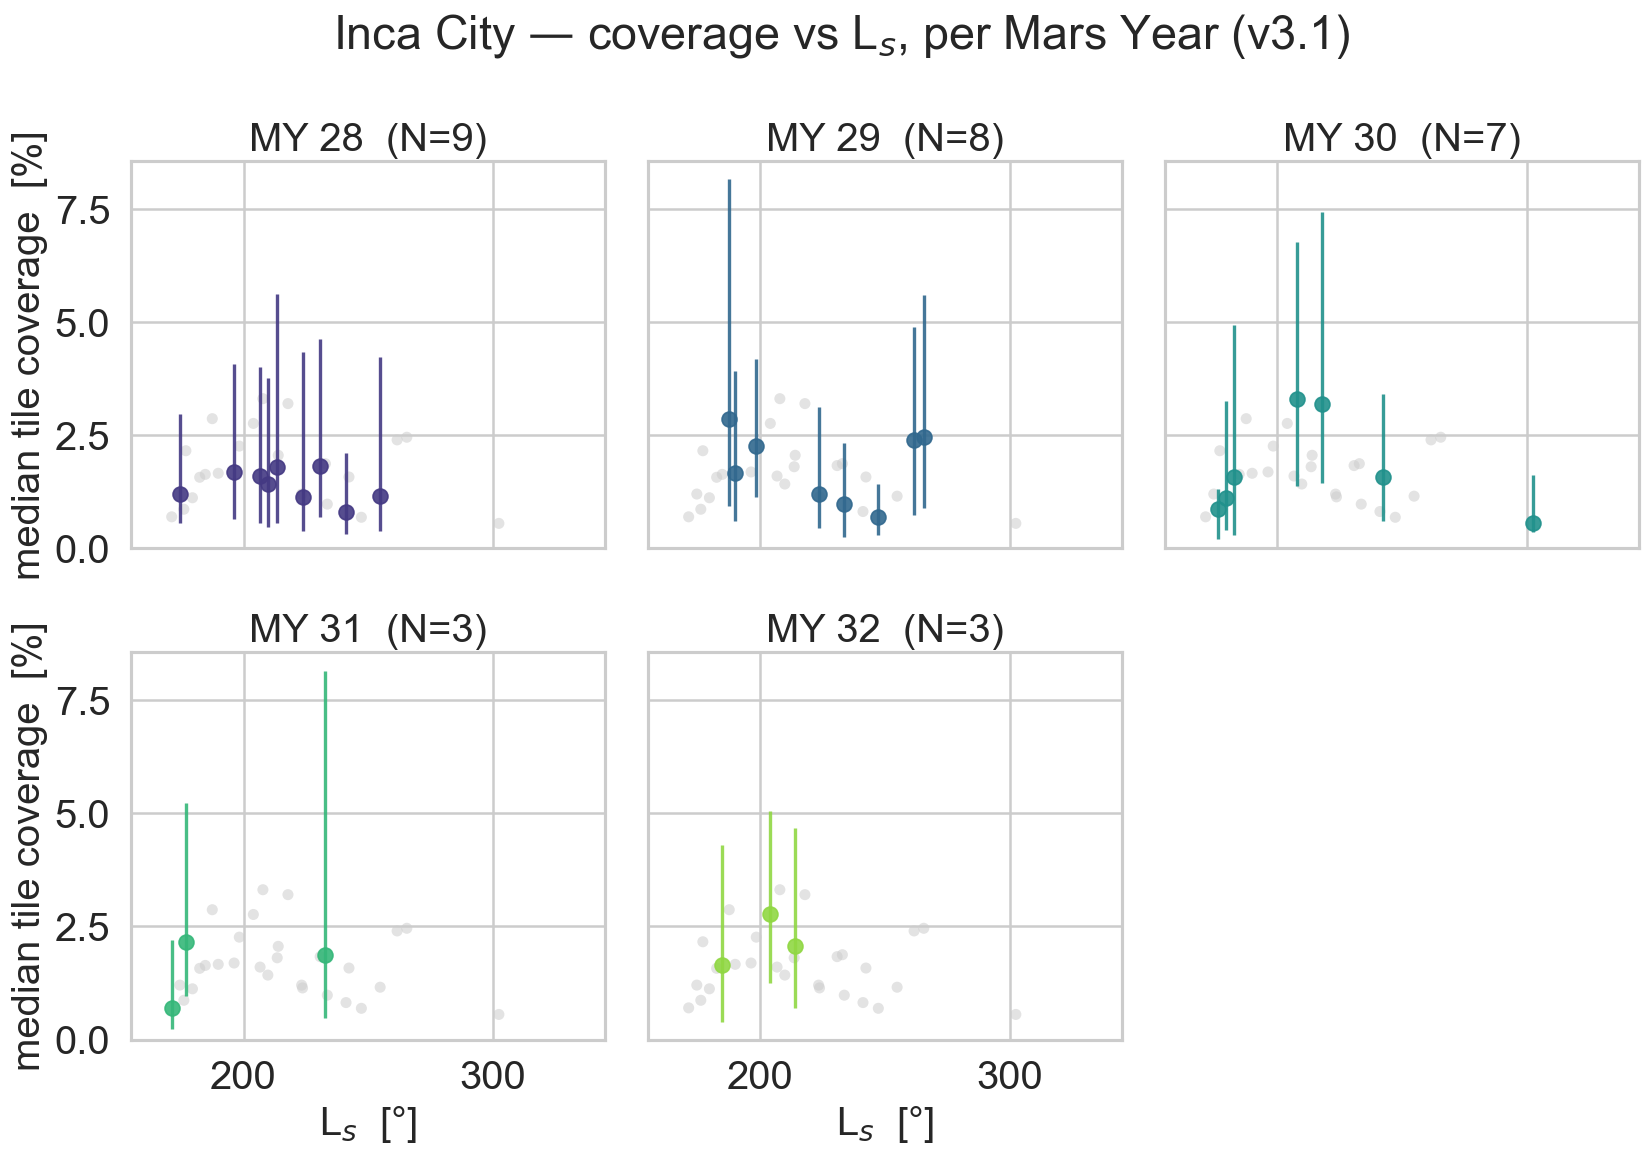
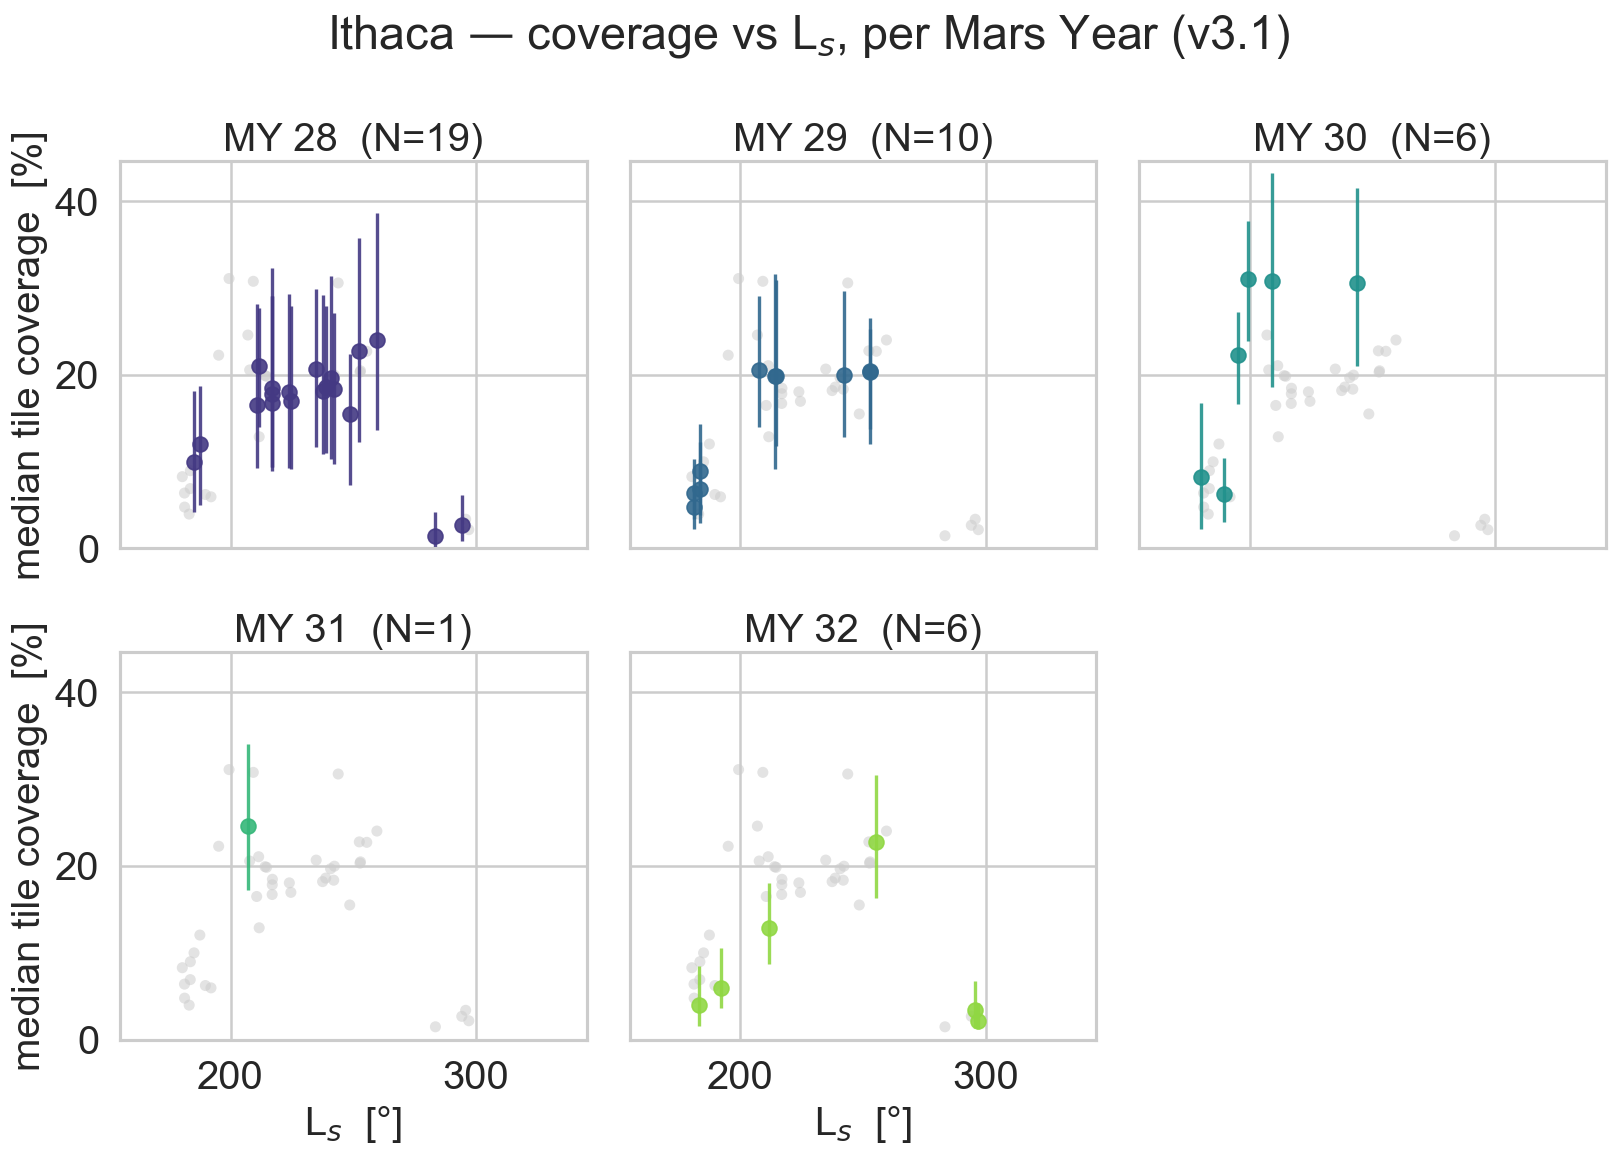
Inca City (low, canonical) vs Ithaca (~10× higher). Compare within a region across years — never pool across regions that differ this much.

Ithaca up close — why it’s the outlier

HiRISE — Ithaca’s seasonal ice carpeted with large, dramatic fans

Fan directions accumulating through the season — all blown the same way

Ithaca’s ice is carpeted with large fans → ~10× a typical ROI’s coverage. Same physics, extreme expression — keep it separate in any cross-ROI aggregate.

A short ROI tour

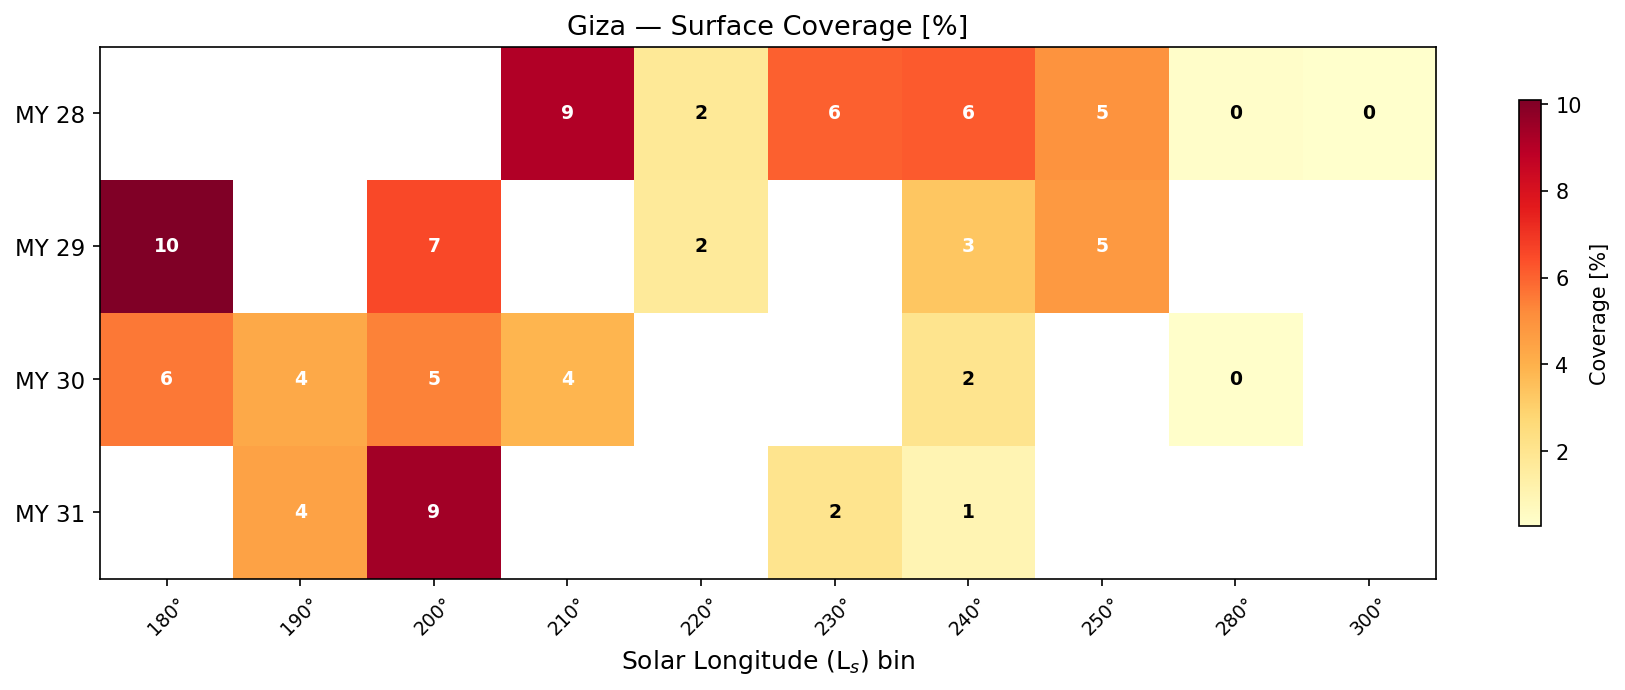
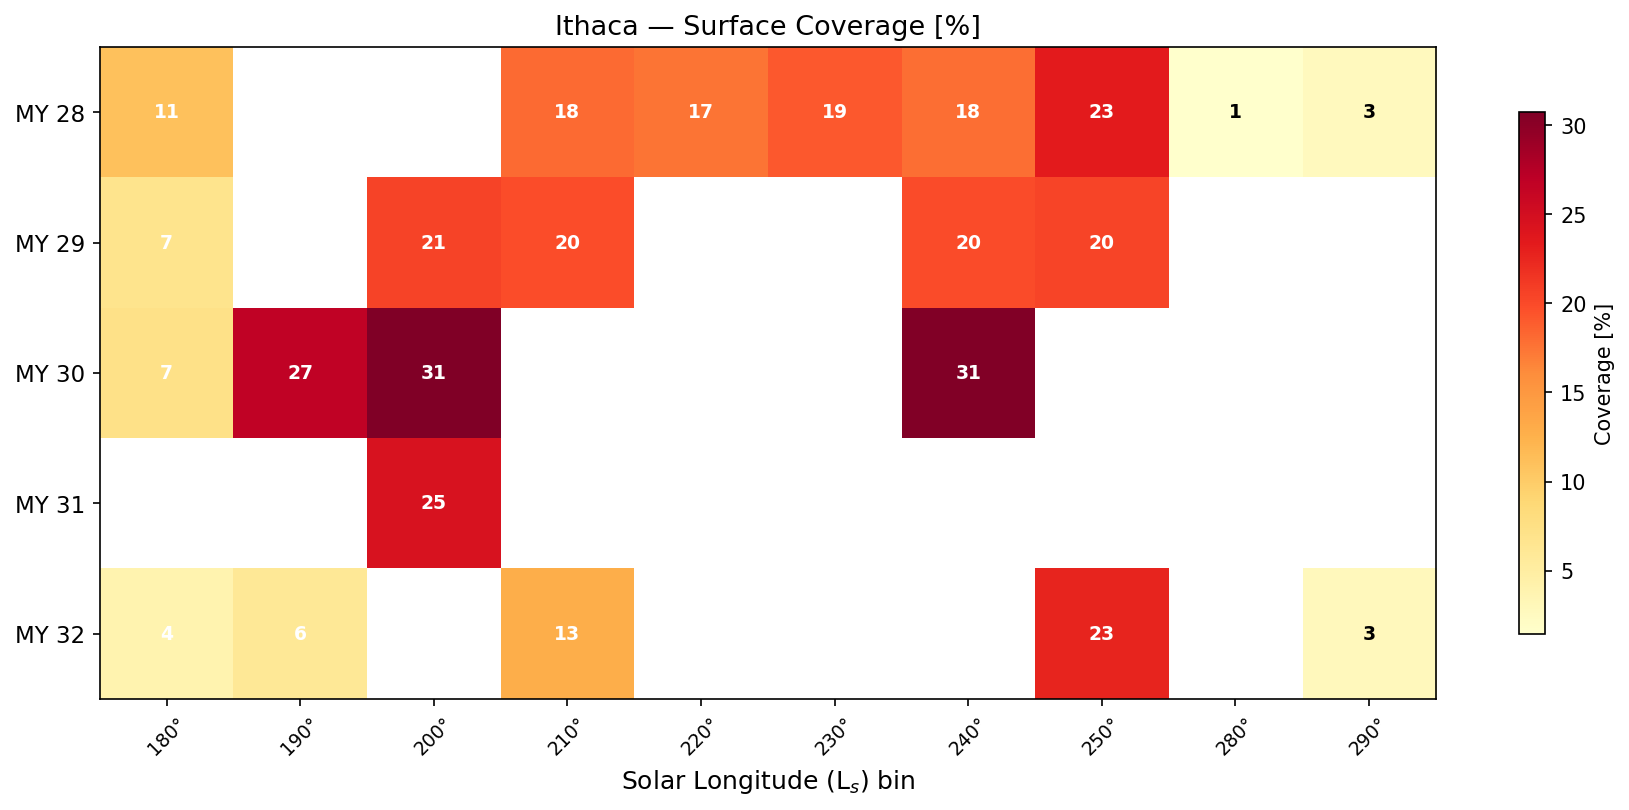
Per-ROI (MY × Ls) heatmaps. Ithaca is the outlier (~10× typical) — it must be treated separately in any cap-wide aggregate.

What we did next: match ROI + Ls — but first, the same ground?

Ithaca — every Mars Year’s footprints overlap

Manhattan Classic — same story

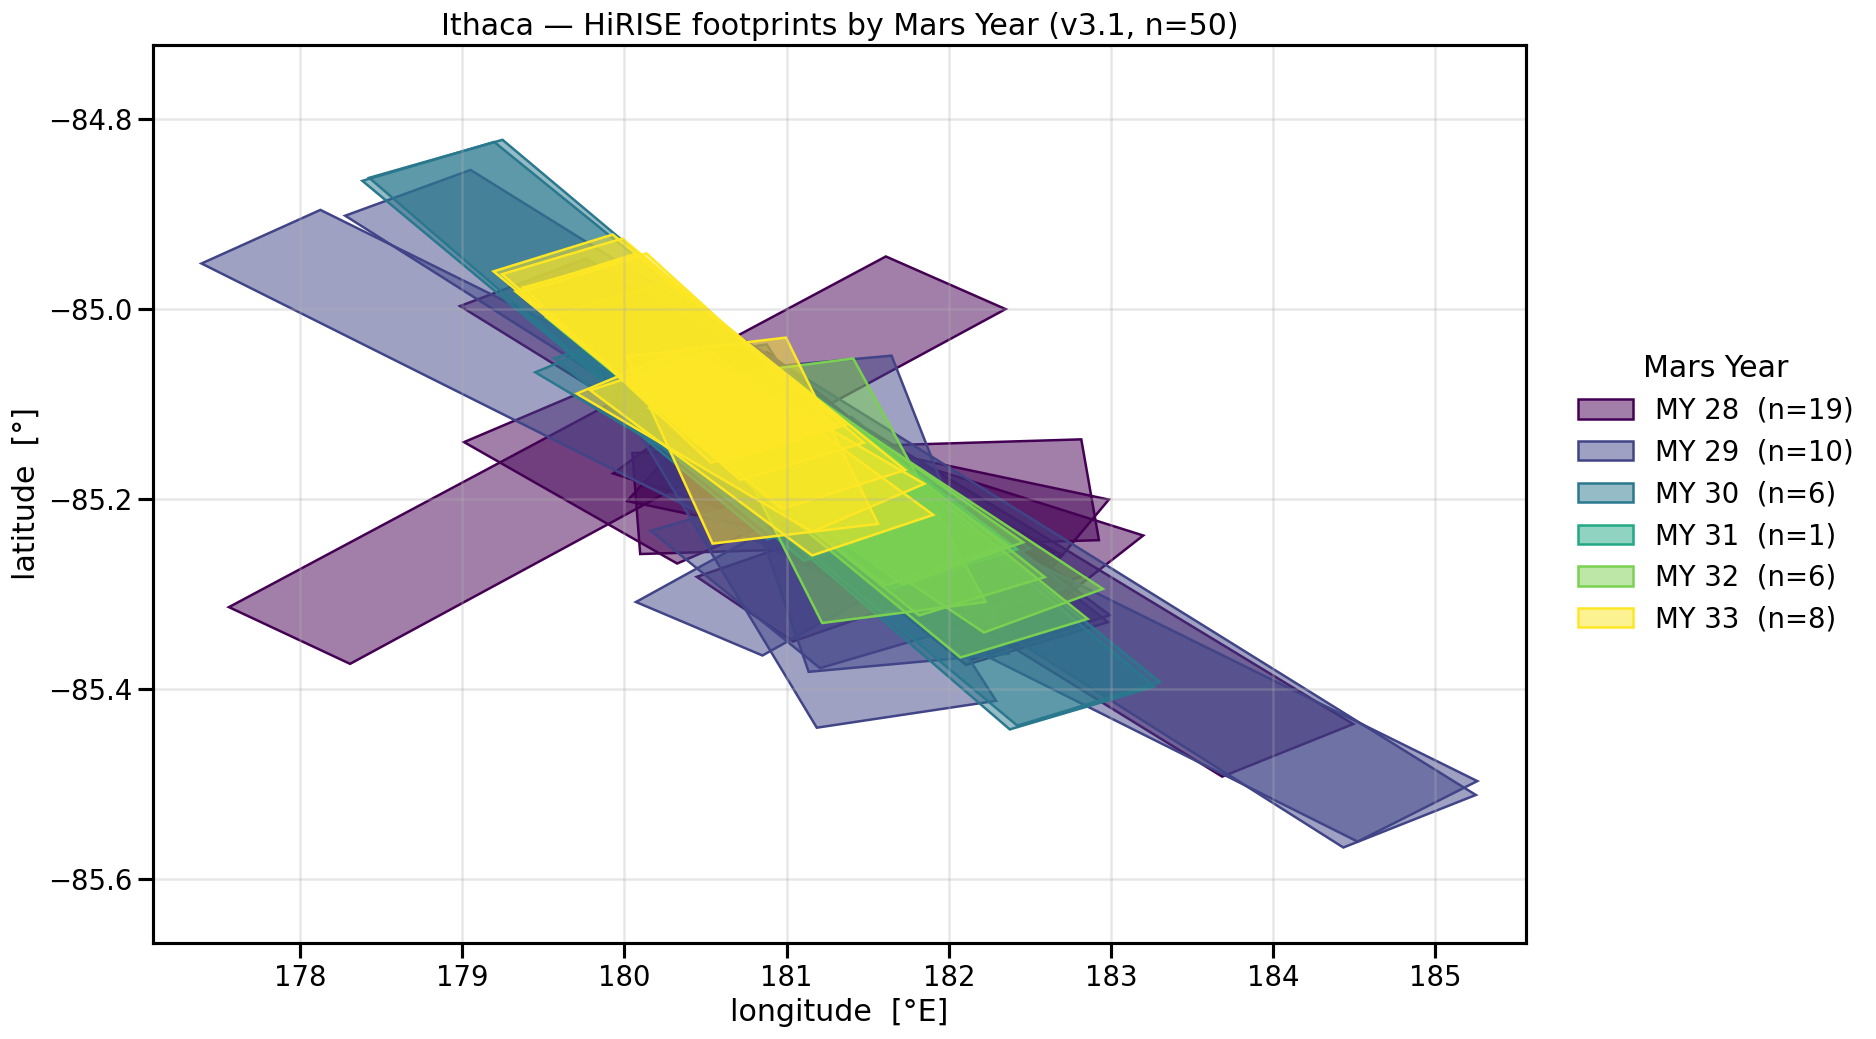
All six Mars Years’ footprints pile onto the same patch — MY 33 (yellow) right in the middle. Comparing years within a ROI compares the same ground, not different terrain.

MY 33 — more eruptions everywhere, calm wind only at Ithaca

Ithaca vs Manhattan Classic — fans/obs (blue) & blotches/obs (red) per Mars Year, matched Ls ∈ [180°, 240°]
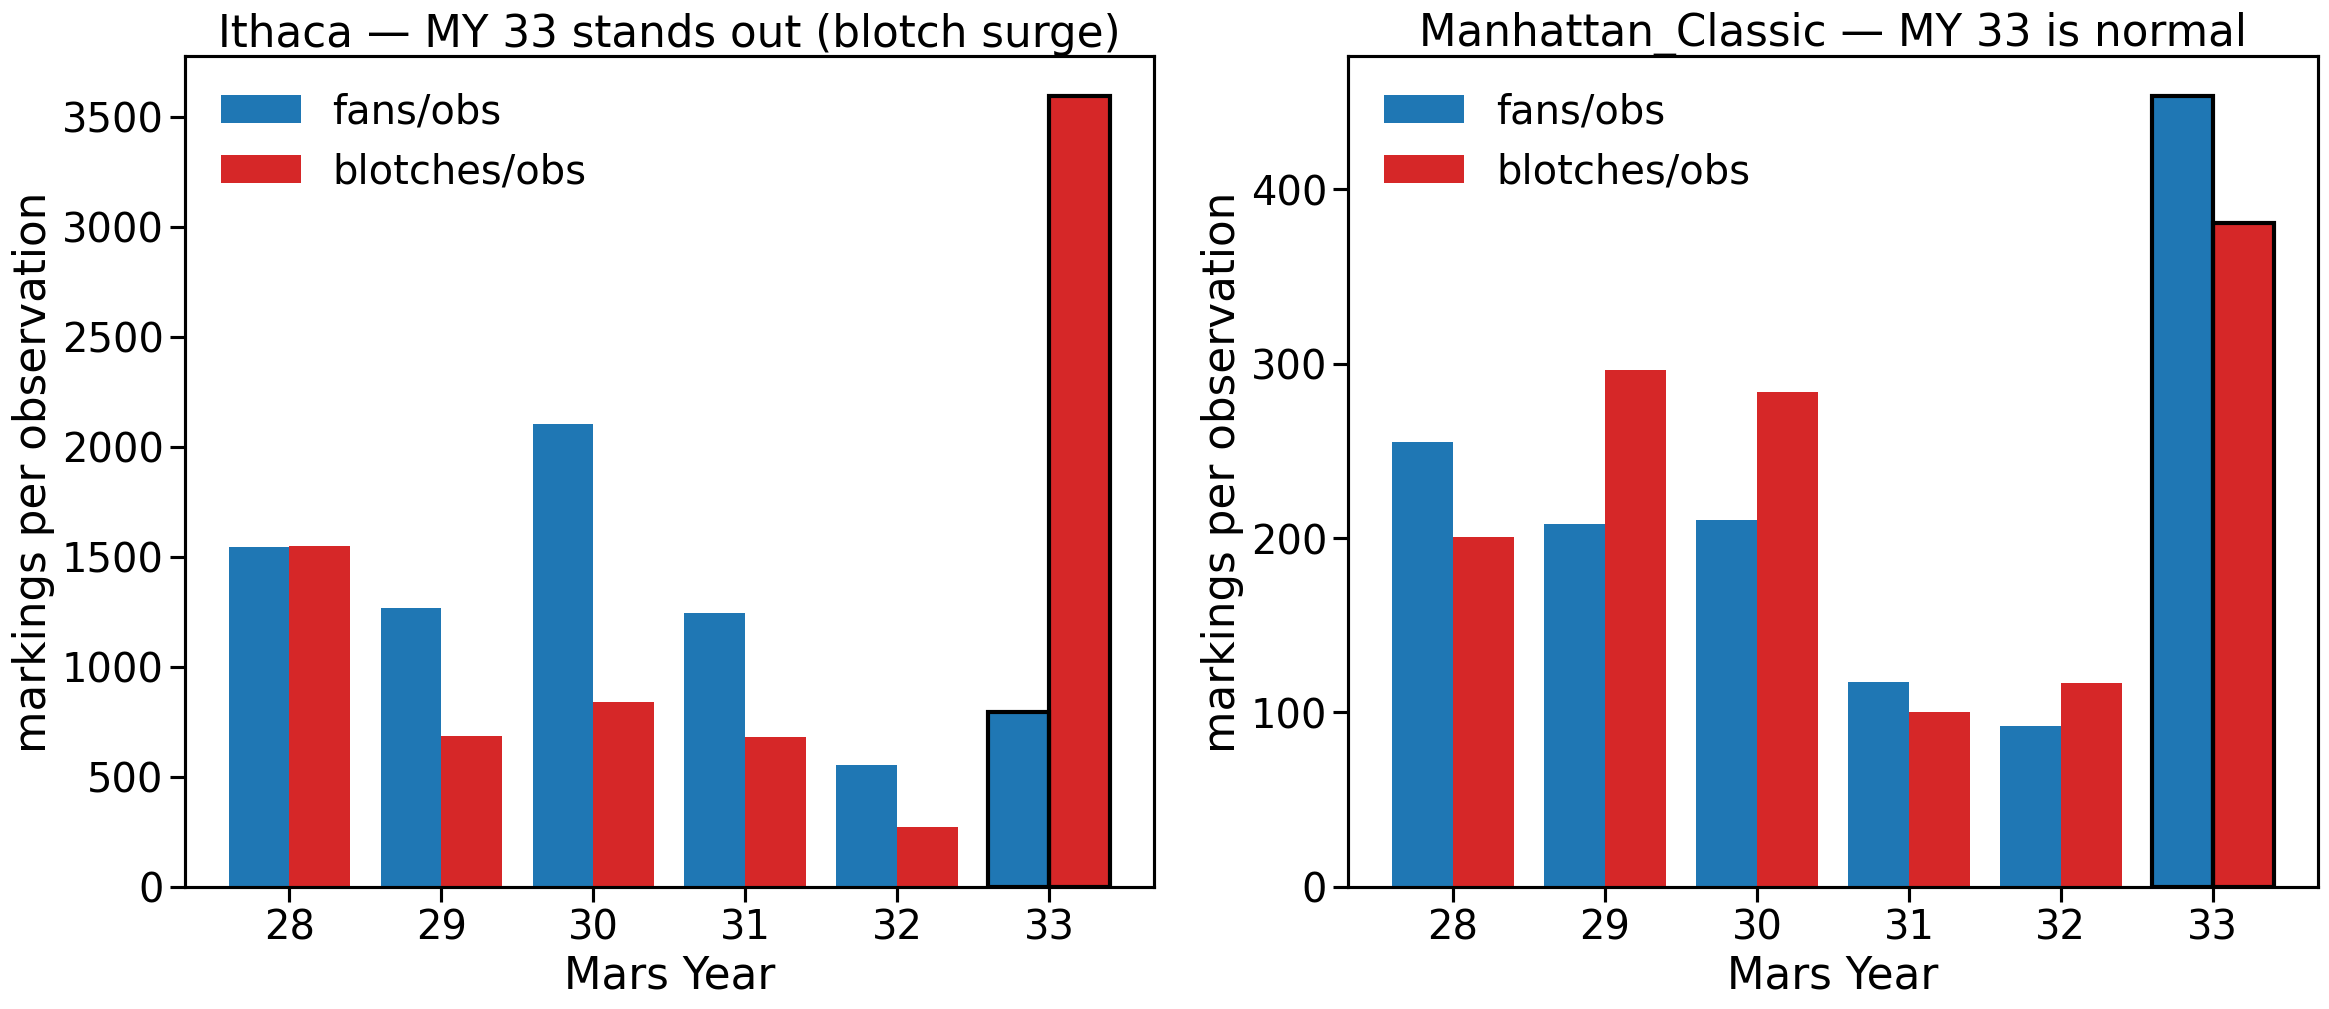
  • Restrict to the same two ROIs MY 33 actually sampled, same Ls — compare like with like
  • MY 33 activity ≈ ×2 in both ROIs → more eruption events: plausibly a shared / global driver
  • But the fan → blotch flip is only at Ithaca → unusually calm local wind, so ejecta drops as blotches, not wind-shaped fans
  • A hypothesis to test, not a cap-wide trend — this is the payoff of stratifying properly

MY 31 Manhattan Classic — stronger, more directional wind

Manhattan Classic fan geometry by Mars Year — MY 31 fans are longer and narrower
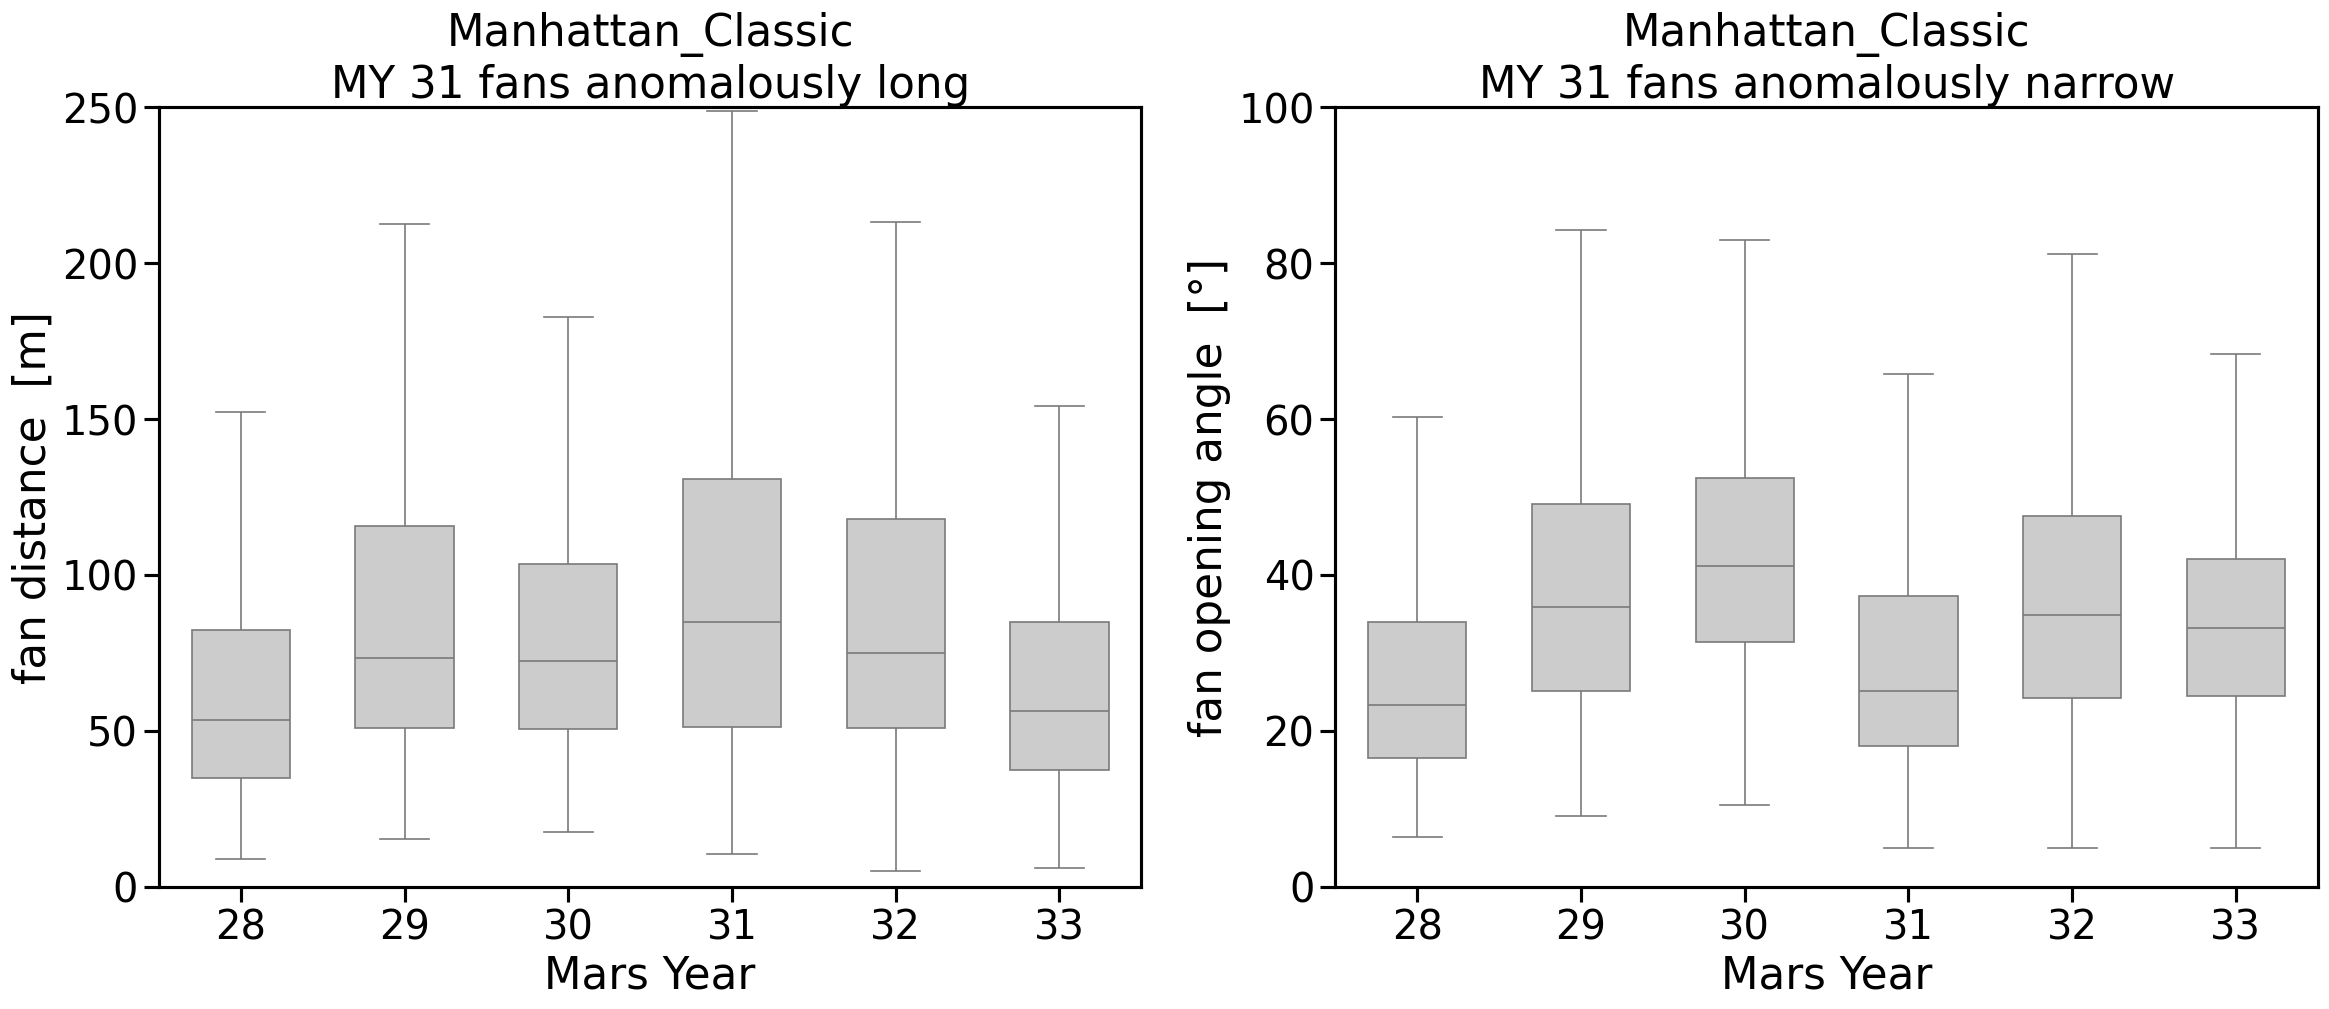
  • MY 31 fans ~24 % longer and ~26 % narrower than the MY 28–32 cluster
  • That year’s activity sits at the low end → fewer eruptions, each under stronger, more directionally-focused wind
  • Another single-(MY × ROI) signal — local, physical, testable

MY 32 Ithaca — a coverage shape-shift (suggestive)

Ithaca per-tile coverage distribution by Mars Year — MY 32 (red ★) piles up at low coverage
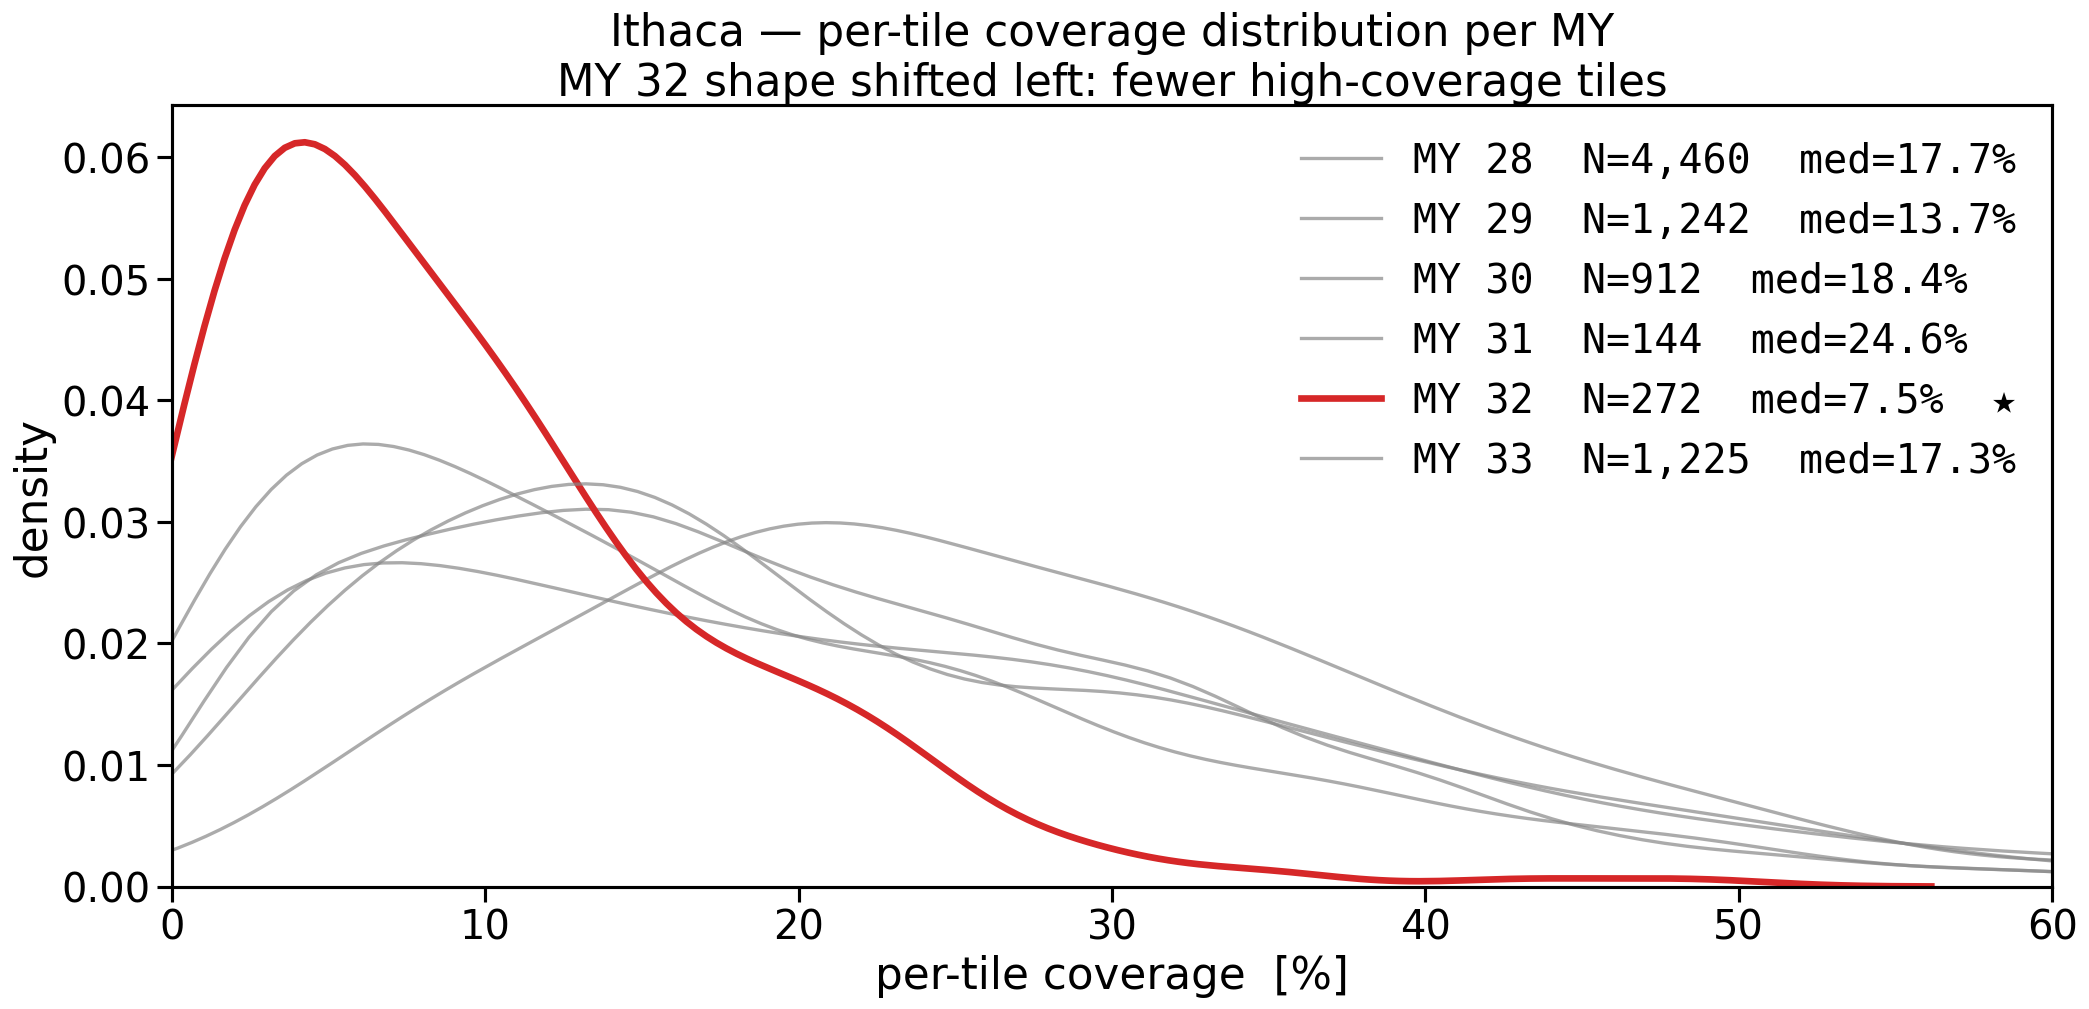
  • MY 32’s per-tile coverage piles up at low values — median 7.5 % vs the typical 14–18 %
  • Fan geometry stays normal (distance, spread, fan-fraction all typical) → a tile-coverage shape shift, not a fan effect
  • Only 3 observations → flagged suggestive: a target for follow-up once more MY 32 Ithaca data arrive

Four signatures, four readings

MY × ROI n Signature Physical reading
MY 31 Manhattan Classic 6 fans ×1.24 longer · ×0.74 narrower · low activity stronger, more directional wind
MY 33 Ithaca 5 activity ×2.04 · fan-fraction 0.63 → 0.18 more eruptions (shared) + calm local wind → blotch surge
MY 33 Manhattan Classic 5 activity ×2.22 · fan/blotch ratio normal more eruptions (shared) + normal wind → calm wind is local to Ithaca
MY 32 Ithaca 3 tile-coverage shifted low suggestive — needs more observations

MY 33 across both ROIs: the ×2 activity is shared (a candidate global driver); the fan→blotch flip is local to Ithaca (a local wind anomaly). Every one of these stays hidden until ROI and Ls are matched.

The lesson — heterogeneous datasets

An average over a heterogeneous, unevenly-sampled population is not a measurement — it is an artifact of the sampling.

  • Check the n behind every aggregate cell before you read a trend into it
  • A change in a pooled statistic can be pure composition change (Simpson’s paradox)
  • Stratify first: verify the signal within each stratum, in every stratum
  • Only aggregate across strata you have shown to be comparable

V · Where We Go Next

Off-active darkening — a parallel channel

  • Beyond discrete fans/blotches, the background CO2 ice darkens diffusely
  • Mechanism: a thin homogeneous dust mantle from lighter grains carried by wider jet activity (Pommerol et al. 2011)
  • Photometric quantification (north cap) by (Portyankina et al. 2013); recent N–S synthesis (Hansen et al. 2024)
  • Planet Four does not capture this — it is a parallel contribution to the seasonal albedo budget

Conclusions

  • Two-tier reliability: wind directions are sharp & reliable; coverage area and deposit counts carry real uncertainty
  • v3.1 catalog is openly redistributable (Zenodo + p4tools)
  • Cap-wide coverage: median 4.88 %, heavy right tail — not the folklore 20–30 %
  • Within-ROI distributions repeat across MY 28–33
  • Beware the all-ROI average — uneven ROI sampling fakes inter-annual trends
  • Combine with off-active darkening for a complete albedo budget
  • Now training an AI on P4 labels to extend coverage from the colour strip to the 5× larger RED channel

One last thing — for the students

  • Mistakes are the essence of progress — every scientific advance is built on them
  • We just dress them up: “insufficiencies,” “a hole in the inference logic,” “limitations of prior work” — masking words for the very same thing
  • Strip the disguise and it is always a mistake, small or large, that brought us forward — this talk is proof: our MY 33 “trend” was wrong, and being wrong opened the real science
  • So don’t be afraid of them. Run into them with open arms, screaming. A mistake will always teach you where to go next.

References

Aye, K-Michael, Megan E Schwamb, Ganna Portyankina, et al. 2019. “Planet Four: Probing Springtime Winds on Mars by Mapping the Southern Polar CO2 Jet Deposits.” Icarus 319 (February): 558–98. https://doi.org/10.1016/j.icarus.2018.08.018.
Hansen, Candice J., Shane Byrne, Wendy M. Calvin, et al. 2024. “A Comparison of CO\(_2\) Seasonal Activity in Mars’s Northern and Southern Hemispheres.” Icarus 419: 115801. https://doi.org/10.1016/j.icarus.2023.115801.
Kieffer, Hugh H. 2007. “Cold Jets in the Martian Polar Caps.” J. Geophys. Res. Planets 112 (E8): E08005. https://doi.org/10.1029/2006JE002816.
Piqueux, Sylvain, Shane Byrne, and Mark I. Richardson. 2003. “Sublimation of Mars’s Southern Seasonal CO\(_2\) Ice Cap and the Formation of Spiders.” J. Geophys. Res. Planets 108 (E8): 5084. https://doi.org/10.1029/2002JE002007.
Pommerol, Antoine, Ganna Portyankina, Nicolas Thomas, et al. 2011. “Evolution of South Seasonal Cap During Martian Spring: Insights from High-Resolution Observations by HiRISE and CRISM on Mars Reconnaissance Orbiter.” J. Geophys. Res. Planets 116 (E08007). https://doi.org/10.1029/2010JE003790.
Portyankina, Ganna, Timothy I Michaels, Klaus-Michael Aye, Megan E Schwamb, Candice J Hansen, and Chris J Lintott. 2022. “Planet Four: Derived South Polar Martian Winds Interpreted Using Mesoscale Modeling.” Planet. Sci. J. 3 (2): 31. https://doi.org/10.3847/PSJ/ac3087.
Portyankina, Ganna, Antoine Pommerol, K.-Michael Aye, Candice J. Hansen, and Nicolas Thomas. 2013. “Observations of the Northern Seasonal Polar Cap on Mars II: HiRISE Photometric Analysis of Evolution of Northern Polar Dunes in Spring.” Icarus 225: 898–910. https://doi.org/10.1016/j.icarus.2012.10.017.